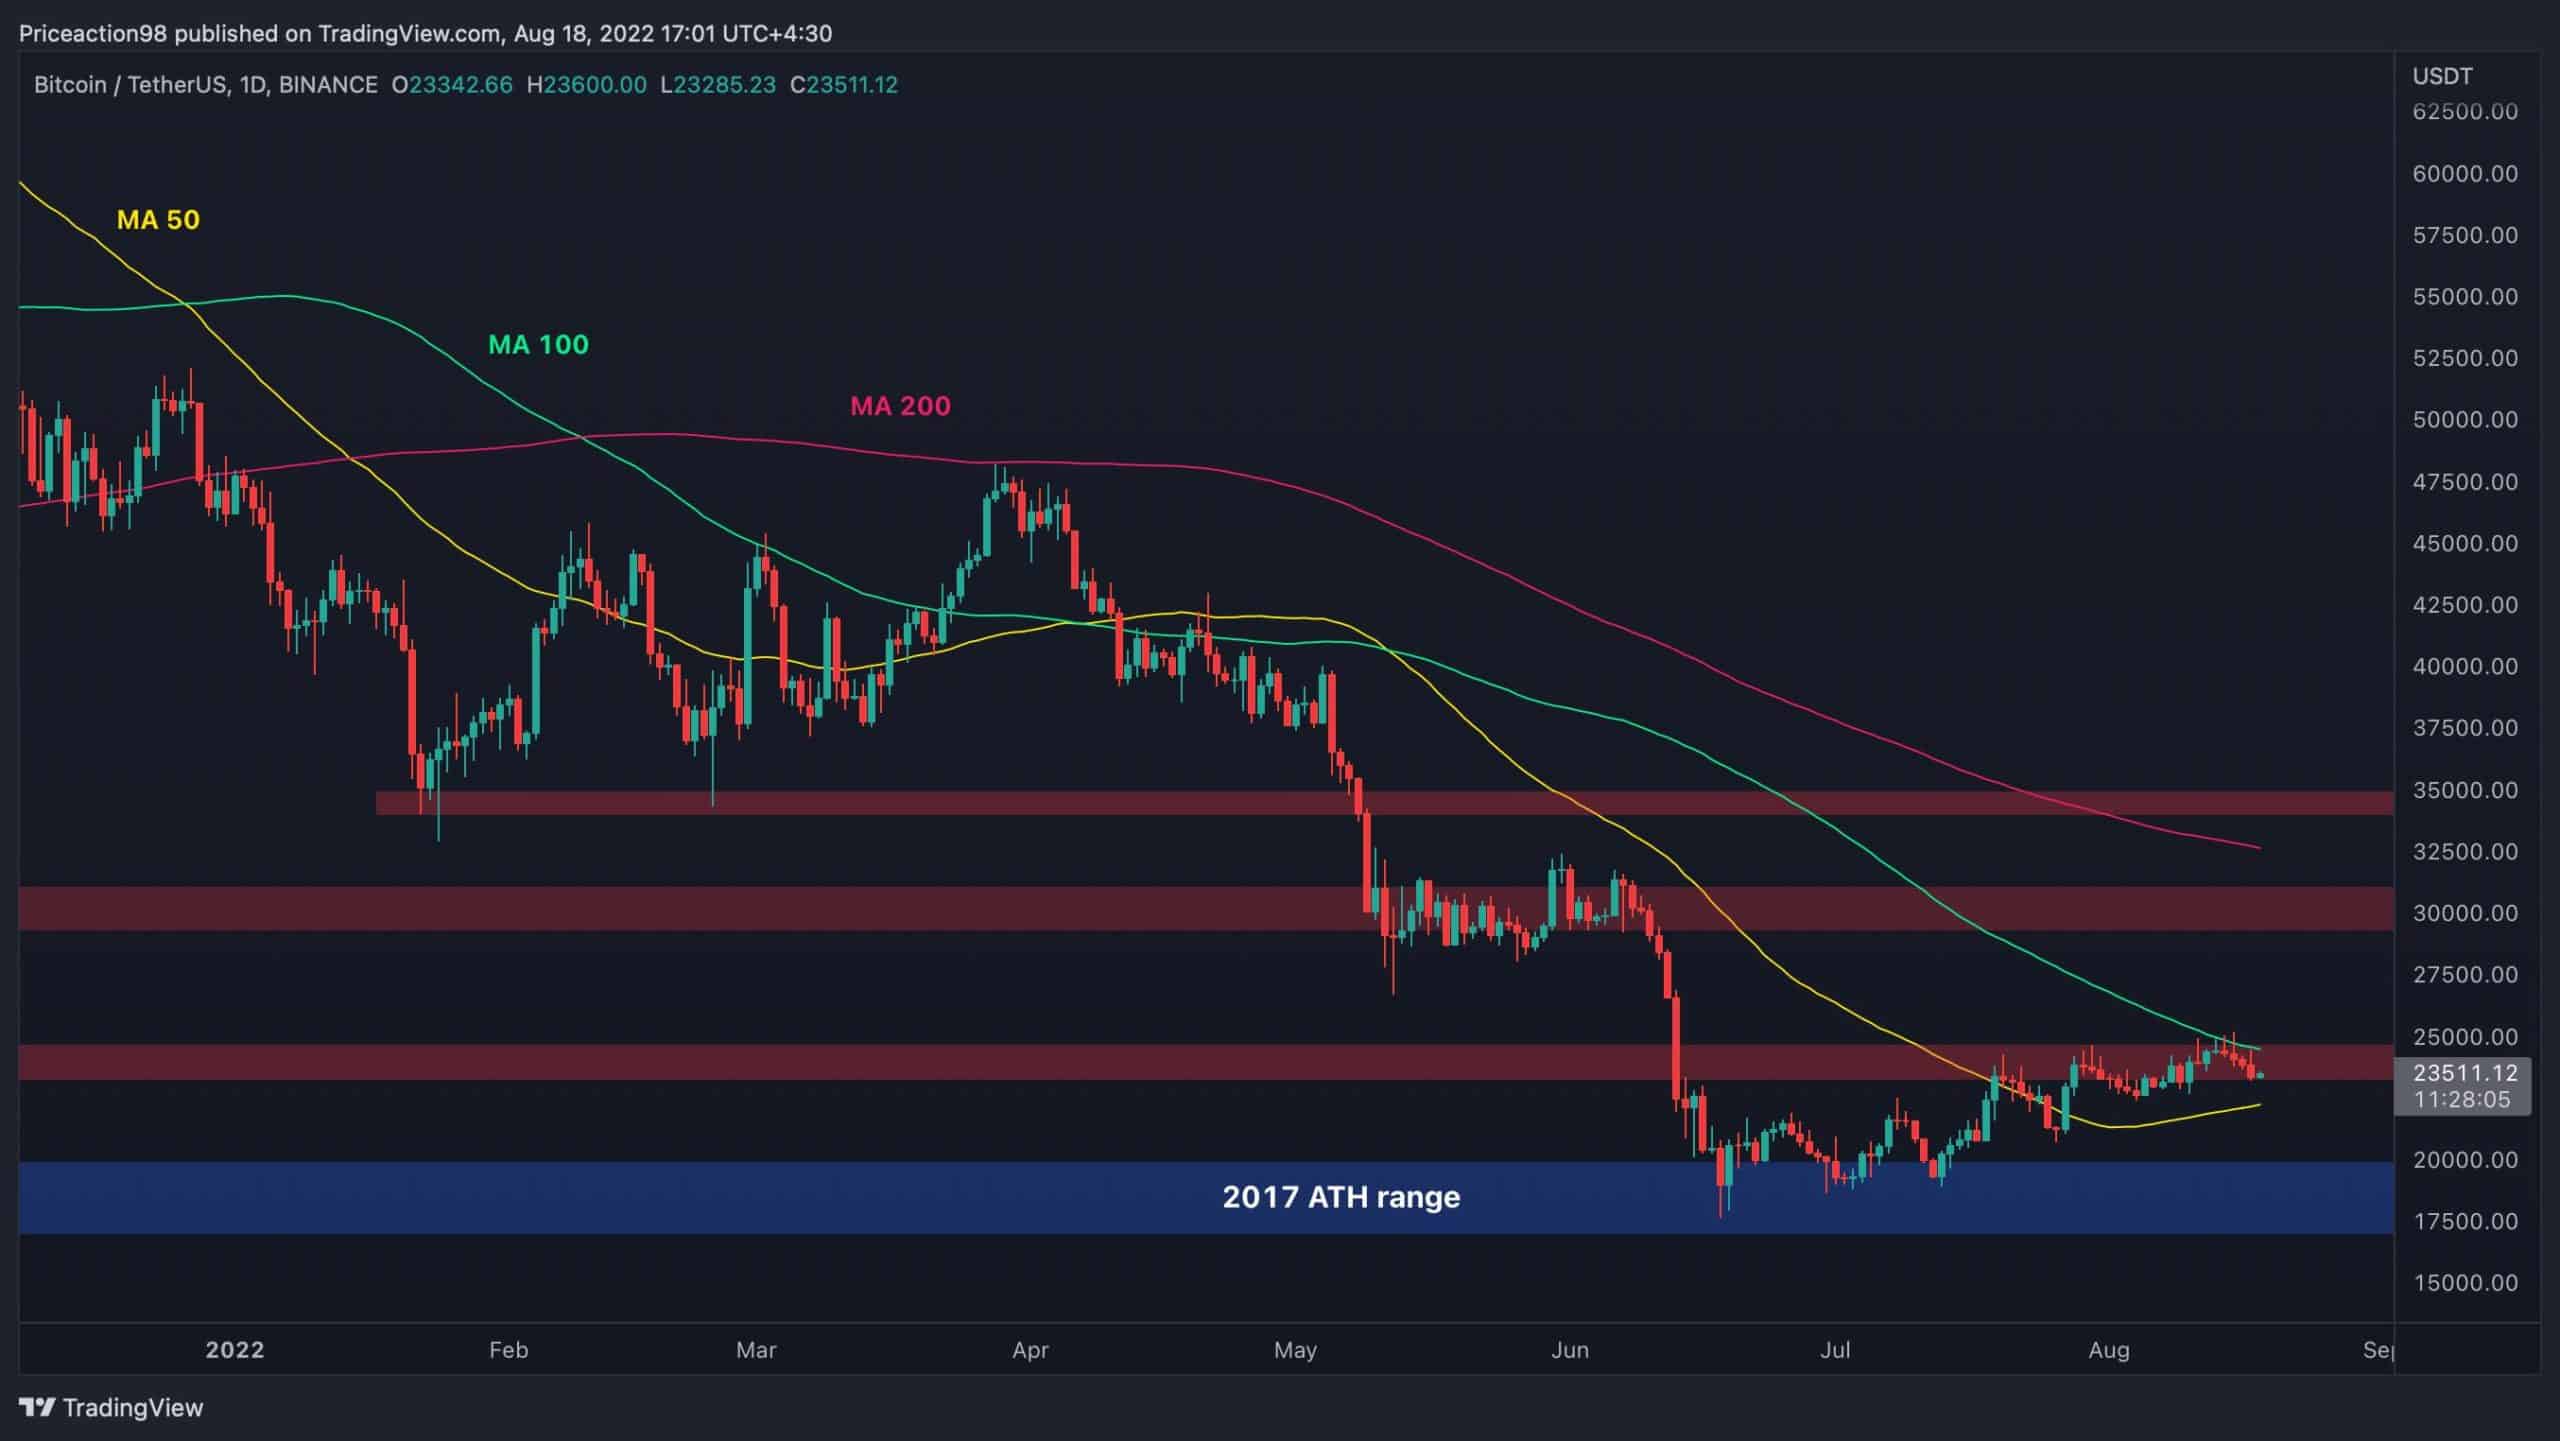
Bitcoin’s relief rally from the $20K area seems to be coming to an end, as the $24K resistance level is rejecting the price once again. The 100-day moving average also acts as a resistance near the same level.
Technical Analysis
By Edris
The Daily Chart:
The 50-day moving average, which is currently located around the $22K level, could provide some support and initiate a rally above the $24K resistance level. In this case, a rapid rise towards the $30K supply zone would be more likely.
Source: TradingView
However, a bullish breakout above the 200-day moving average, which is currently trending around $33K, would be necessary to call the beginning of a new bull market. On the other hand, if the 50-day moving average fails to hold the price, a retest of the $17K-$20K support area would be more probable in the short-term.
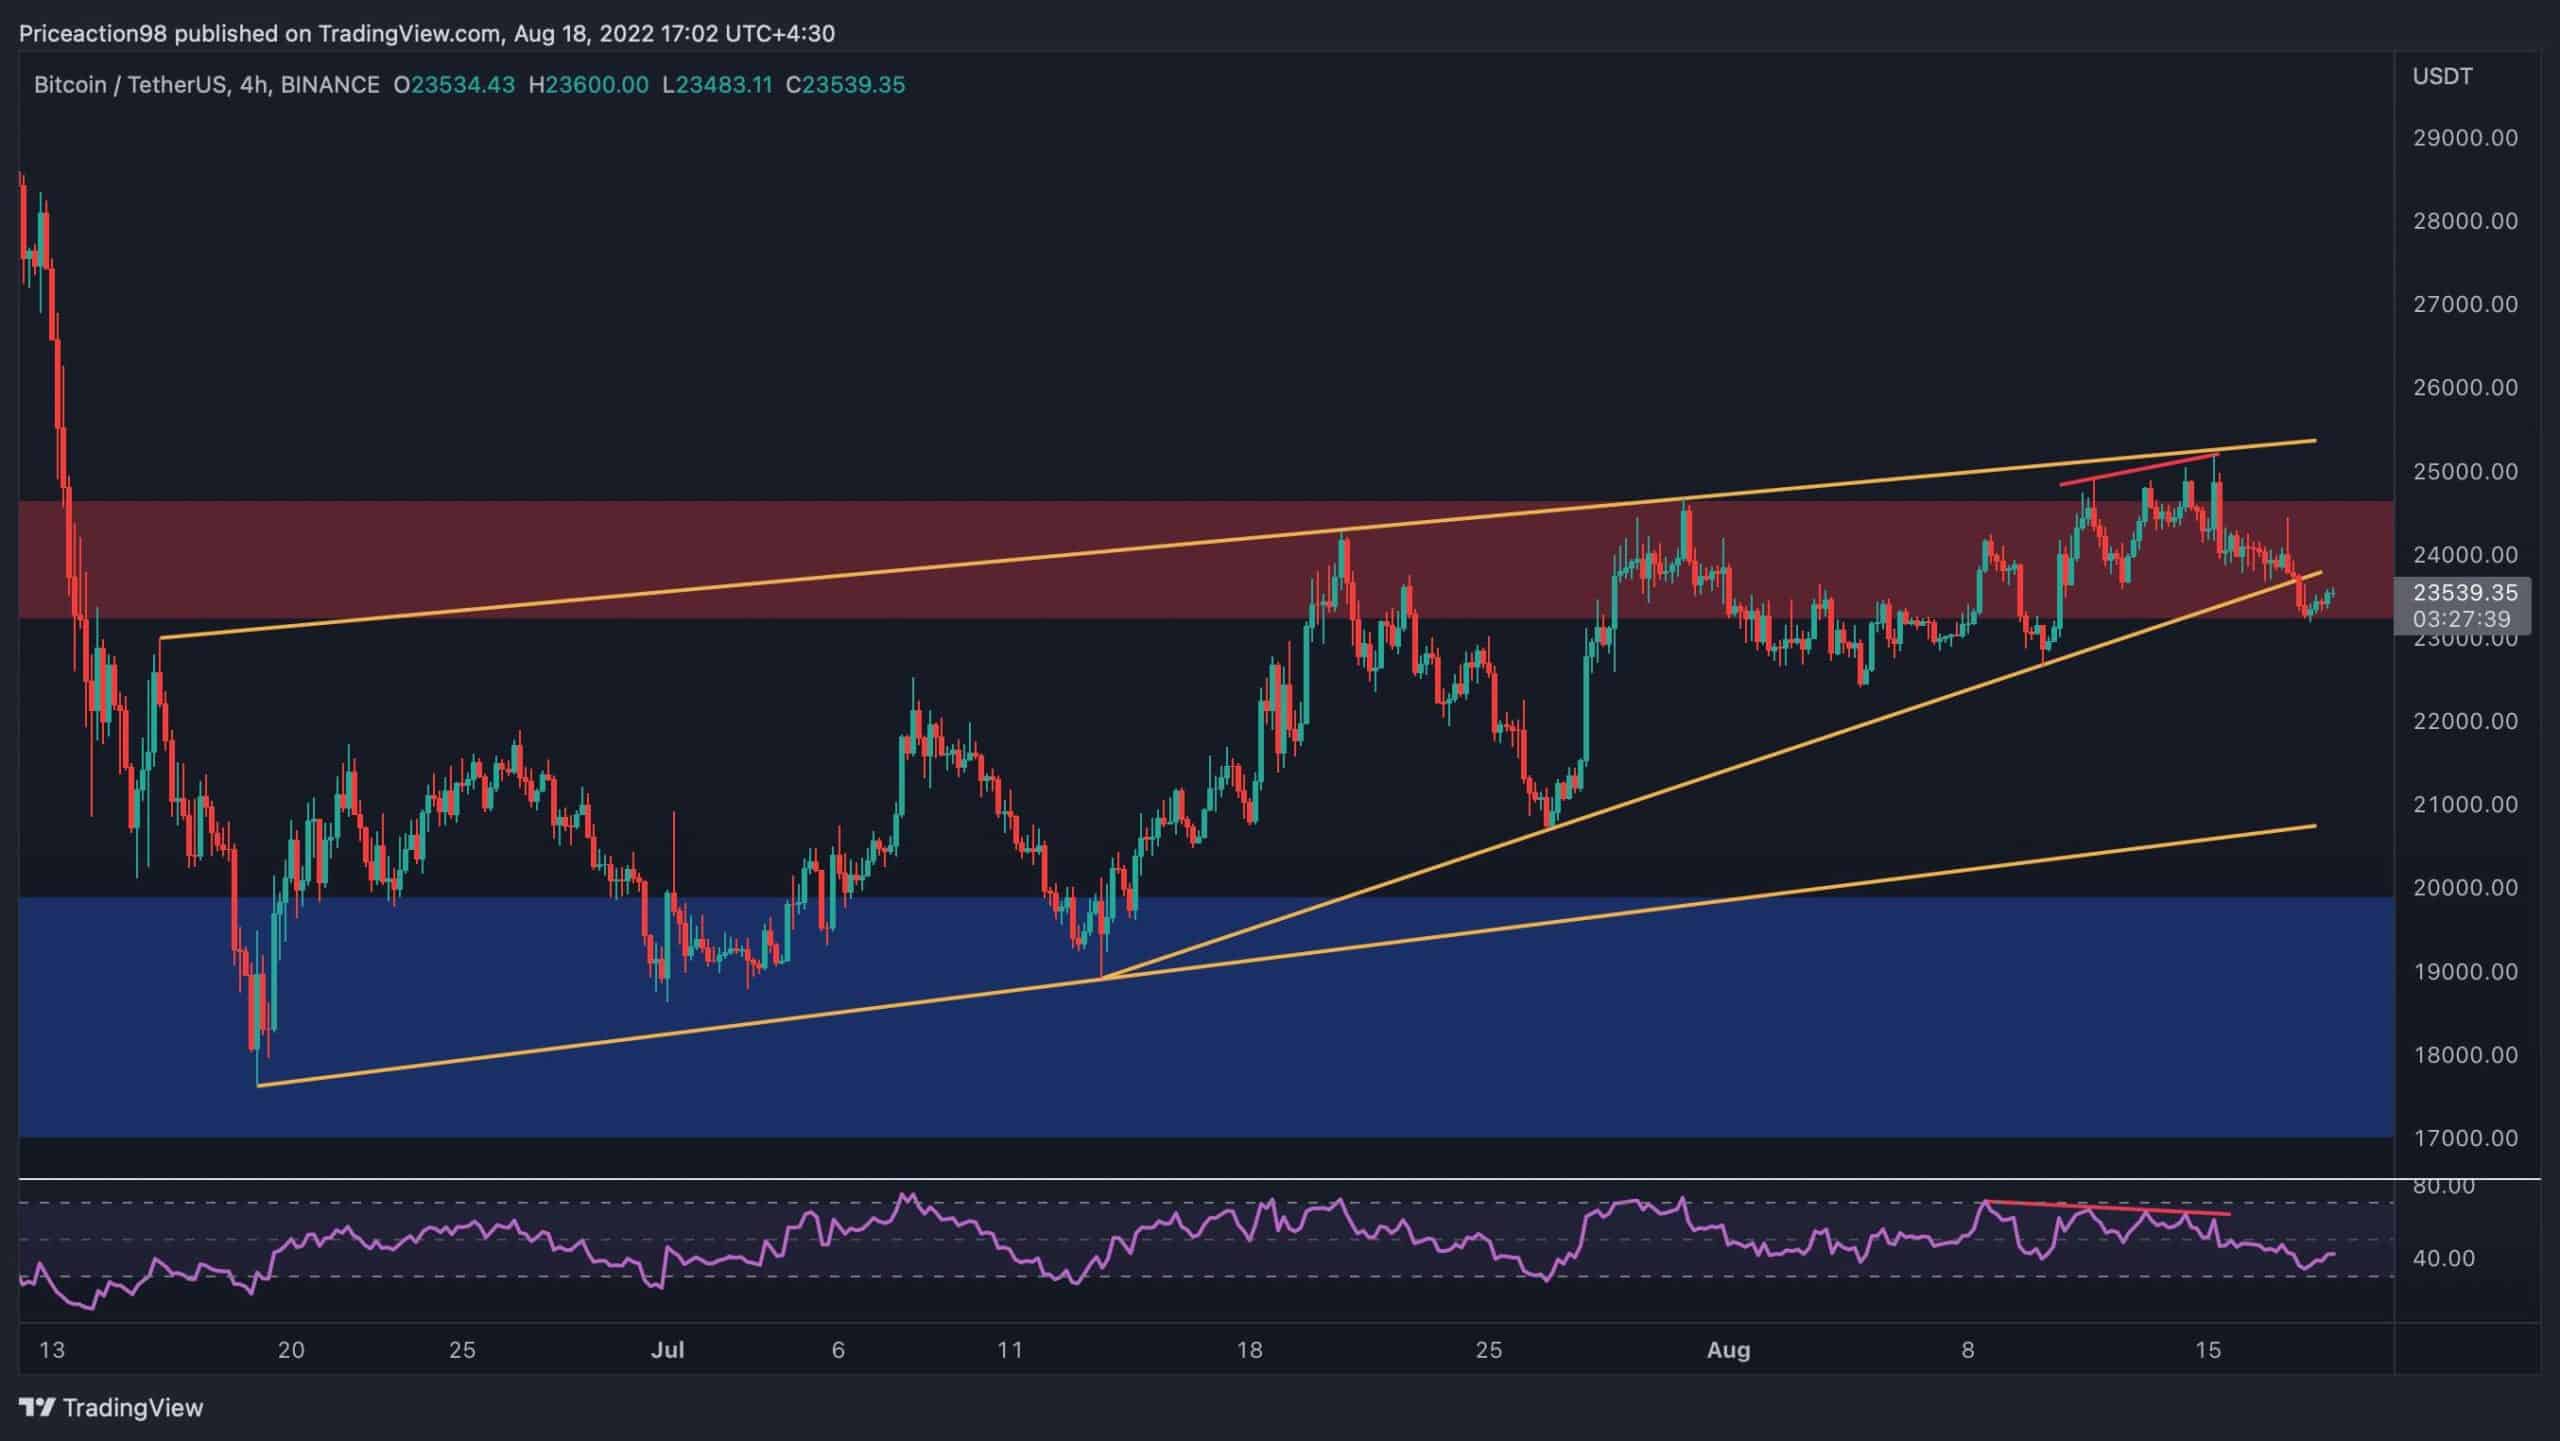
The 4-Hour Chart:
On the 4-hour timeframe, the price has been rejected from the higher boundary of the large bearish flag pattern for the fourth time. The RSI indicator signalled a massive bearish divergence between the last few highs, pointing to a potential reversal.
The price has currently broken below the bullish trendline demonstrated on the chart and seems to be pulling back for a retest and eventual continuation towards the lower boundary of the flag. In this case, it would be highly unlikely that the price rebounds from the lower trendline, and a bearish breakout and continuation towards the $17K level and even lower would be the most likely outcome.
Source: TradingView
The post BTC Looking For Direction Around $23.5K but Worrying Signs Appear (Bitcoin Price Analysis) appeared first on CryptoPotato.
SOL’s price performance over the past 24 hours has been in line with that of the rest of the cryptocurrency market and remains largely in red. Let’s check out some of the more important Solana ecosystem news. Raydium launches Pump.Fun competitor Raydium – Solana’s most popular decentralized exchange – saw a surge in its token’s
A new survey by the blockchain infrastructure provider P2P.org has unveiled some challenges and trends affecting institutions’ crypto adoption strategies. It also highlighted opportunities that institutions could explore to adapt to the evolving practices in the crypto industry. The survey included participation from more than 15 institutional players, with intermediaries, investment funds, and venture capital
Earlier this year, digital asset exchange CryptoCom commenced a legal battle against a Melbourne woman, Thevamanogari Manivel, for failing to return the $10.5 million that was mistakenly sent to her during a $100 refund process. The firm wants the woman to give back the funds, but she has already spent a significant portion of the…
[PRESS RELEASE – Singapore, Singapore, 16th December 2021] As one of the biggest trading competitions worldwide, GFTC hopes to bring together crypto enthusiasts from all over the world. Early bird registration starts on Dec. 15, 2021. Register here. Gate.io’s first Global Futures Trading Competition (GFTC) will be officially open for early-bird registration on Dec. 15,…
[PRESS RELEASE – Panama, Panama City, January 30th, 2024] BlockGuard, a DeFi innovator focused on wealth management, has partnered with Masterblox, a Web3 hyperscaling partner based in Dubai. This partnership is in line with BlockGuard’s 2024 roadmap, which aims to enhance access to DeFi services by integrating MasterBlox’s cutting-edge blockchain solutions into the BlockGuard Wealth
[PRESS RELEASE – George Town, Cayman Islands, June 12th, 2024] The VGX Foundation has announced a partnership with popular web3 game Honeyland, offering rewards utilizing the VGX token for their players. VGX is a token that bridges multiple chains and is focused on bridging utility across GameFi and gaming ecosystems. Honeyland is a popular blockchain-based
[PRESS RELEASE – Dubai, UAE, April 9th, 2024] The new generation launchpad, Raiser.co, has signed on a partnership with MetalCore, to allow quest based access to the beta version of their upcoming web3 game. This partnership introduces a new approach for early adopters looking to gain beta access to upcoming web3 games. Instead of the
After a six-day recovery, Cardano resumes selling pressure following a daily 8% price drop Against USD, Cardano sharply broke below a weekly triangle pattern, after two days of consolidation Against BTC, A breakdown below 530 SAT level could likely send ADA to discover new lows ADA/USD: Triangle Breakdown Followed by Huge Selloff Key Resistance Levels:…
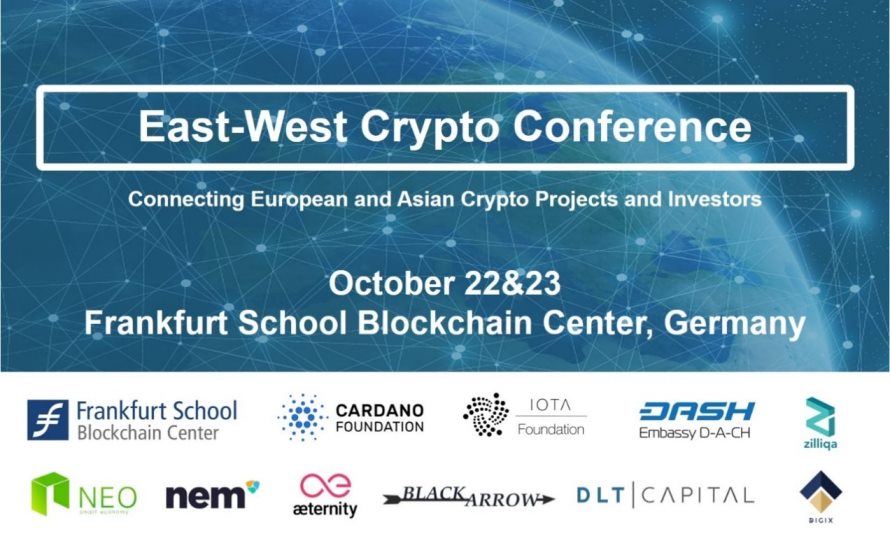
The German Blockchain Week comprises a major international conference that covers all aspects of blockchain, DLT, and crypto assets as well as several Meetups. The events will take place between October 21 and 25 in Frankfurt. East-West Crypto Conference The East-West Crypto Conference will take place on October 22 and 23 and aims at building…