BTC Explodes Above $45K: Here’s the Next Crucial Target (Bitcoin Price Analysis)
Bitcoin’s price has recovered from a sudden drop following a rejection from the $48K level. Meanwhile, the cryptocurrency has yet to reach a higher high.
Technical Analysis
By TradingRage
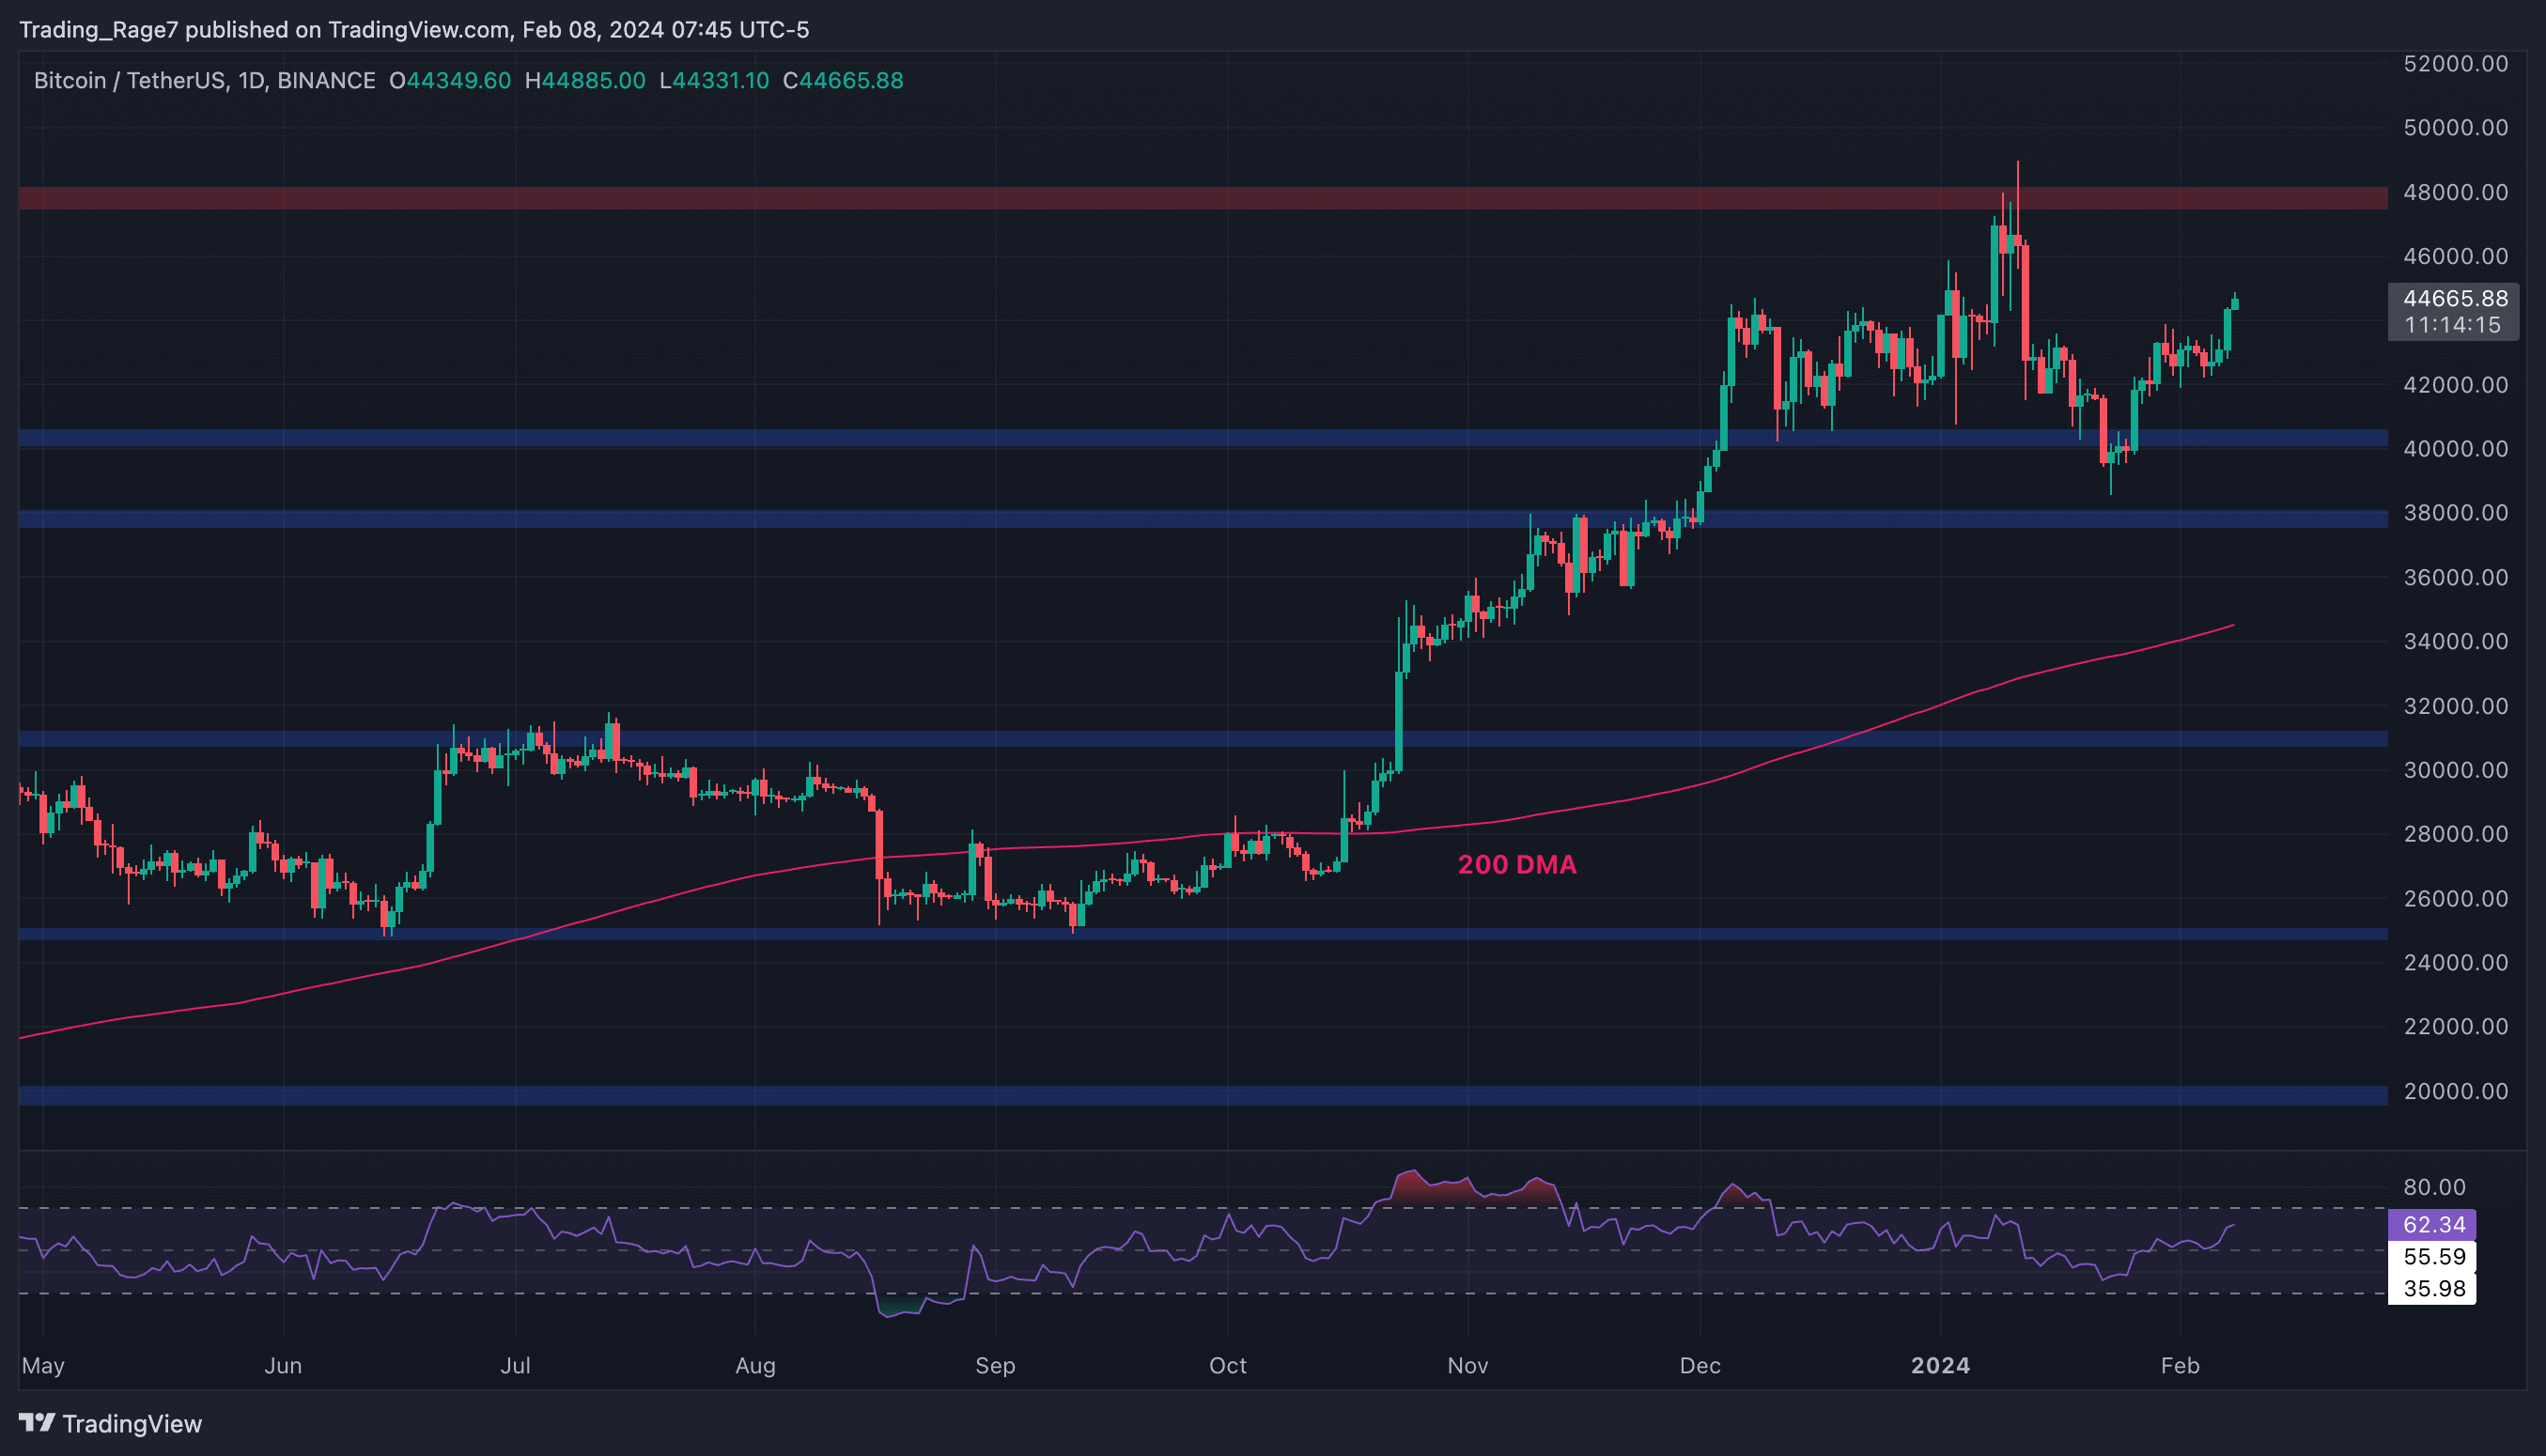
The Daily Chart
On the daily timeframe, the price has been rising over the past few weeks after rebounding from the $40K support level. The market is currently rising toward the $48K resistance level once more. The Relative Strength Index is also showing values above the 50% level, indicating that the momentum is in favor of a further bullish continuation.
In case BTC’s price breaks above the $48K level, the market will likely head for a new all-time high in the coming months.
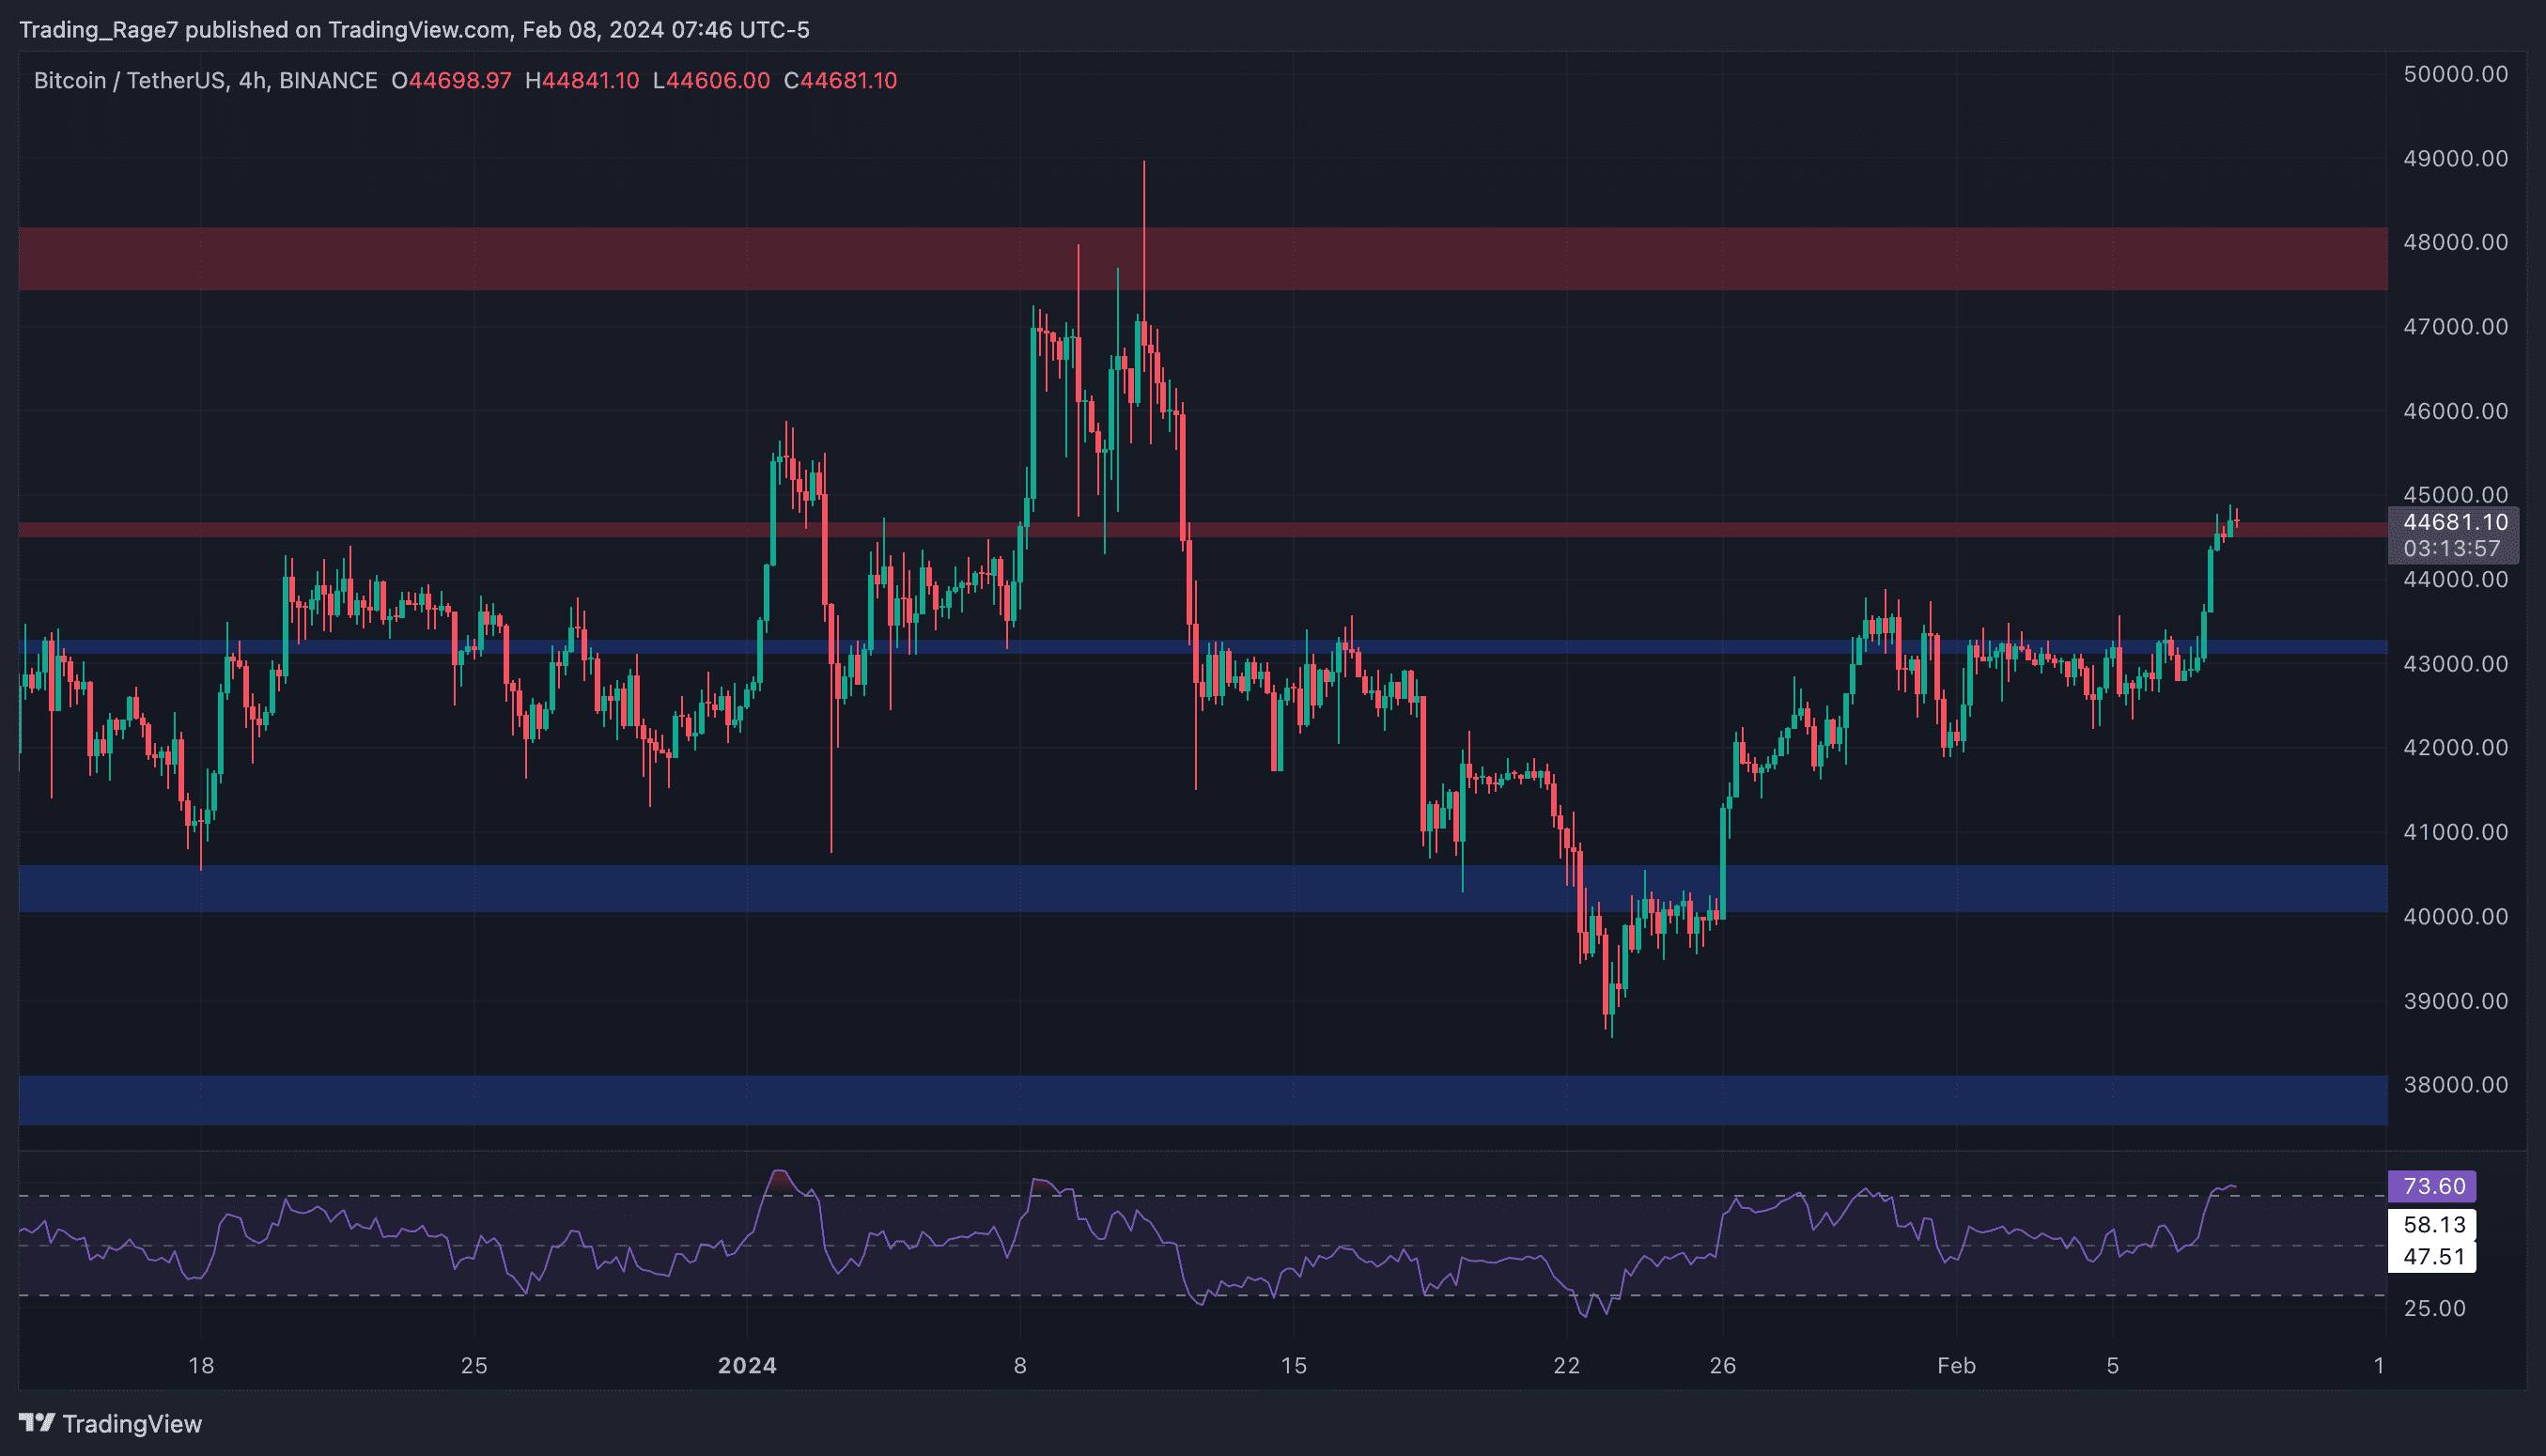
The 4-Hour Chart
Looking at the 4-hour chart, the recent action becomes more clear. The price is currently testing the $45K resistance level, but the momentum is seemingly fading.
The Relative Strength Index is also showing a clear overbought signal. Therefore, it is probable that consolidation or a correction will occur in the short term before the market can continue toward making a higher high.
On-Chain Analysis
By TradingRage
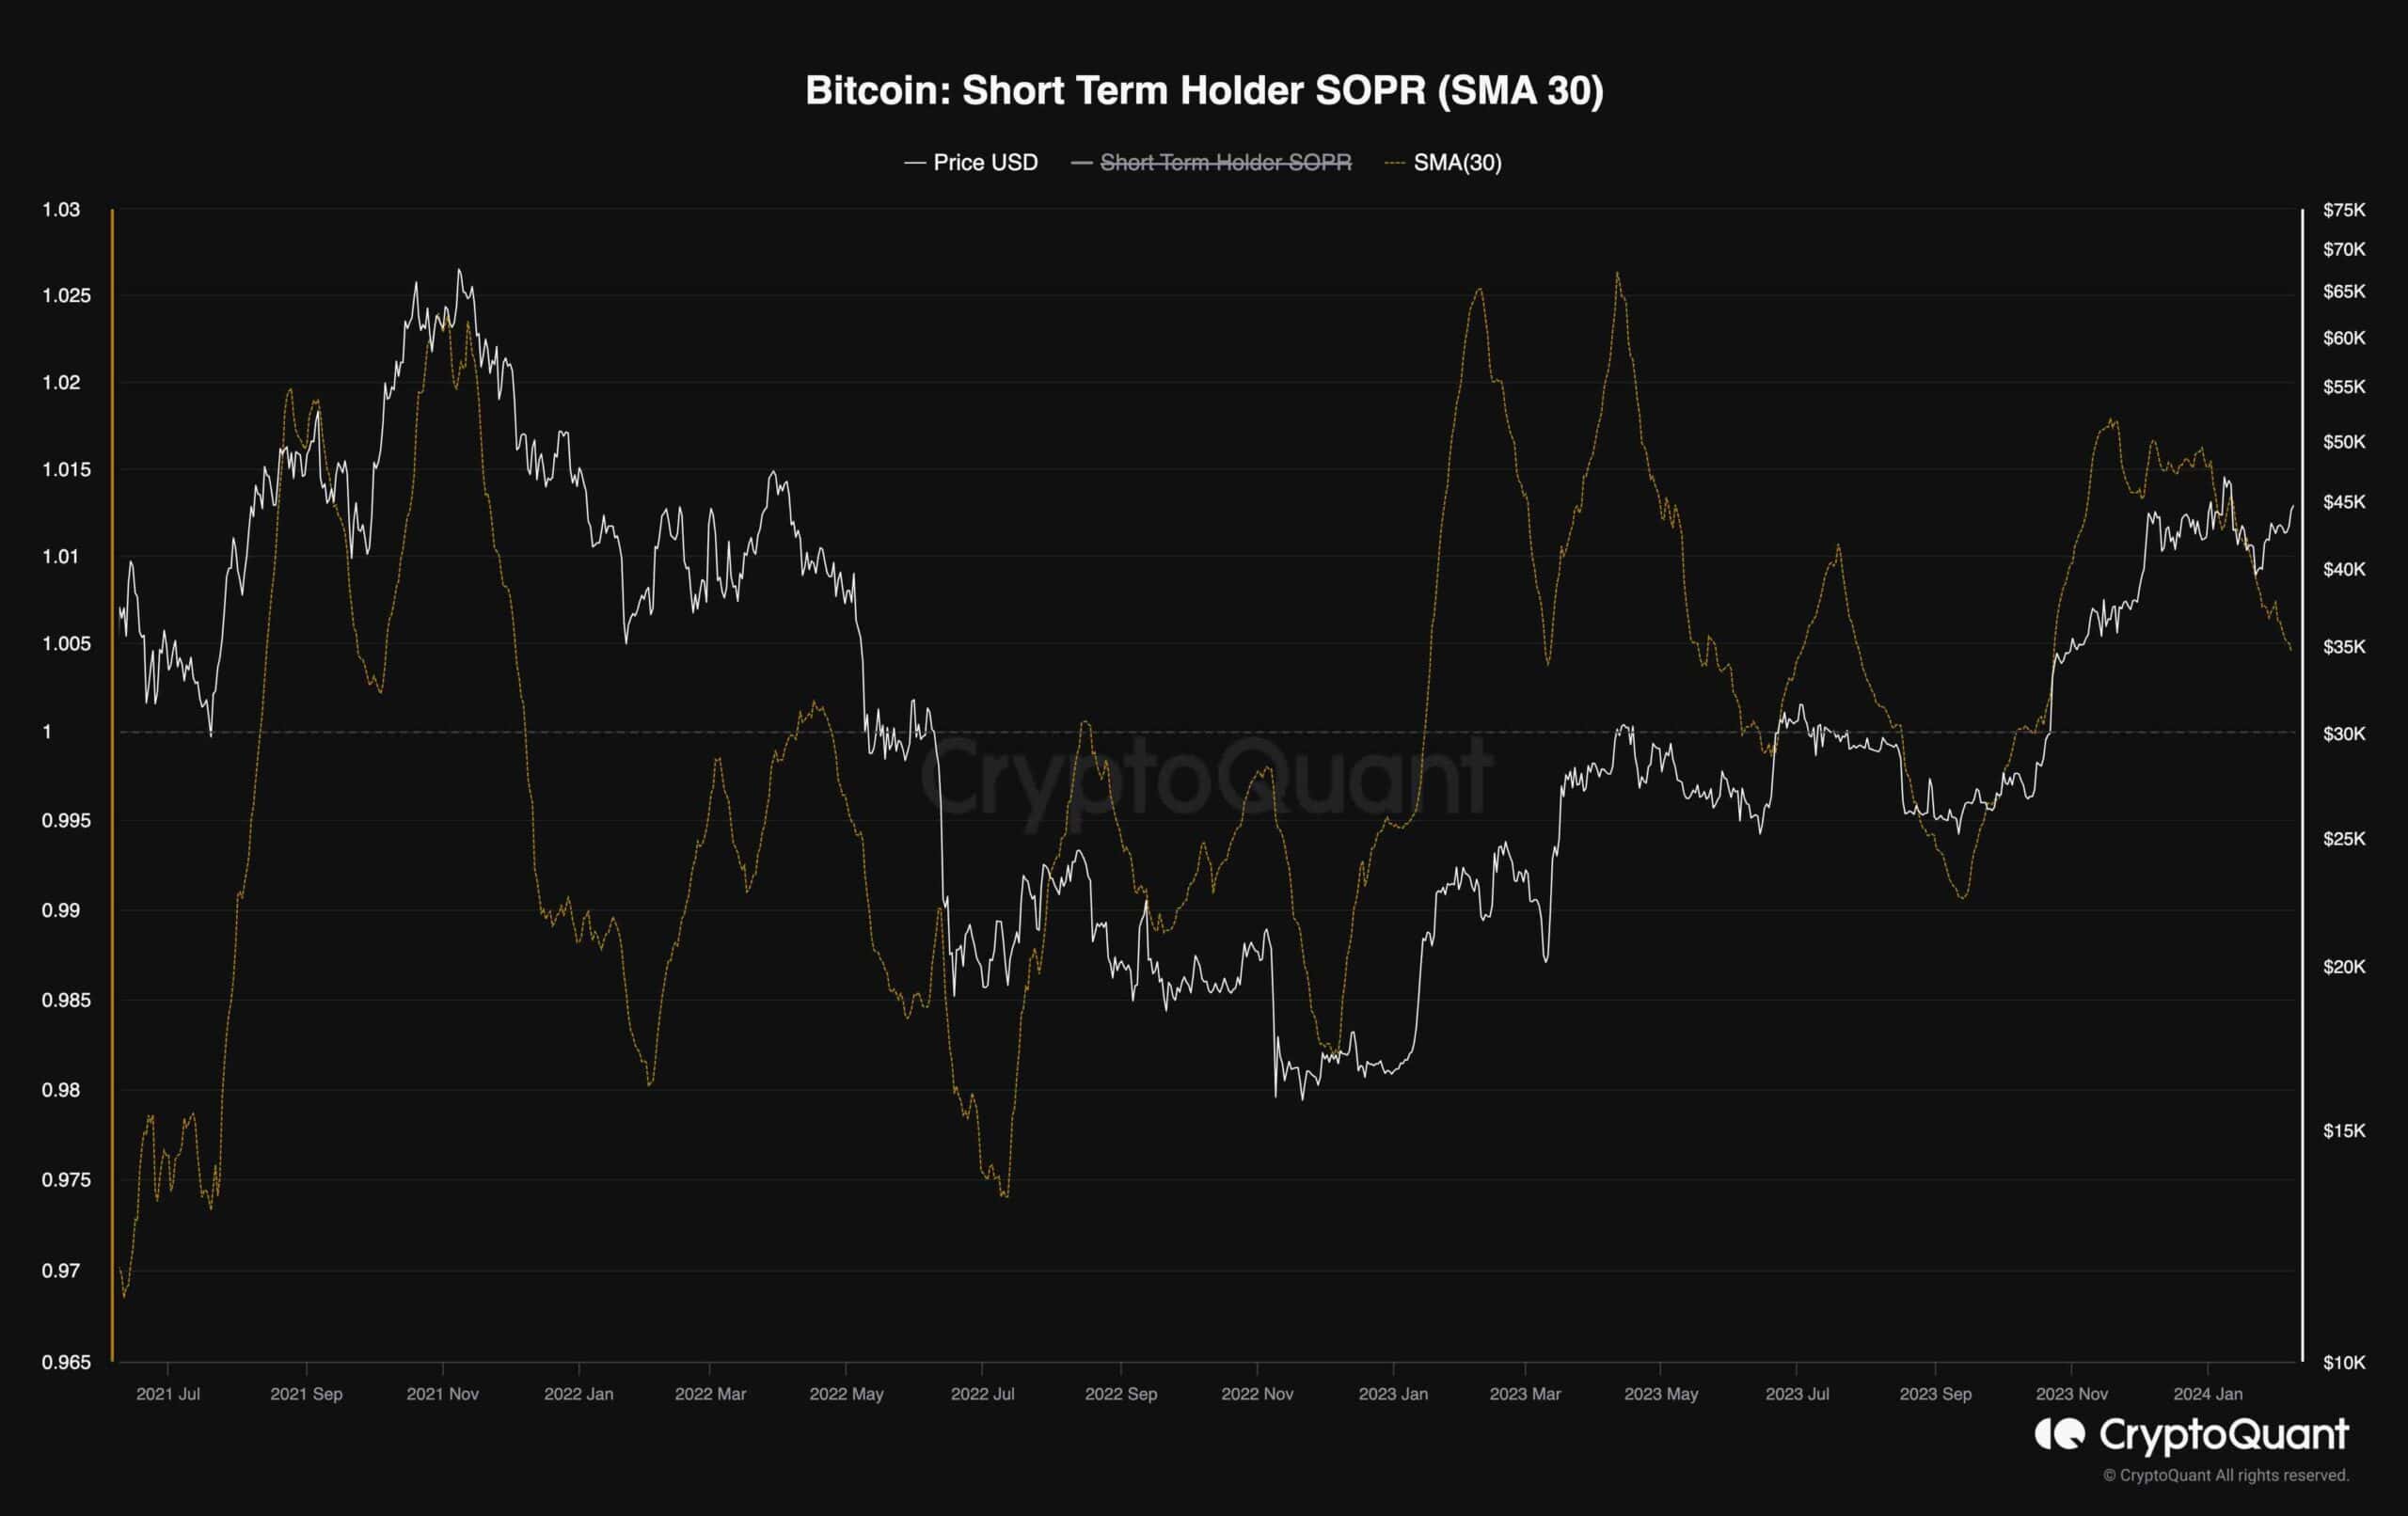
Bitcoin Short-Term Holders Spent Output Profit Ratio (SMA 30)
While Bitcoin’s price has been recovering from the recent drop, some network fundamentals are cooling down. This can be interpreted as a bullish signal, as supply is seemingly shrinking.
This chart demonstrates the Bitcoin short-term holder spent output profit ratio (SOPR). The SOPR metric is a ratio of spent outputs (alive more than 1 hour and less than 155 days) in profit at the time of the window. Values over ‘1’ indicate more short-term investors are selling at a profit. On the contrary, values below ‘1’ indicate that more short-term investors are selling at a loss.
While the SOPR has recently displayed very high values, the metric is currently declining. This points to the fact that many short-term investors have sold their coins, and the selling pressure is decreasing. In case this continues, a sustainable uptrend can be expected in the short term.
The post BTC Explodes Above $45K: Here’s the Next Crucial Target (Bitcoin Price Analysis) appeared first on CryptoPotato.