BTC Consolidation Likely to End With a Huge Move: Bitcoin Price Analysis
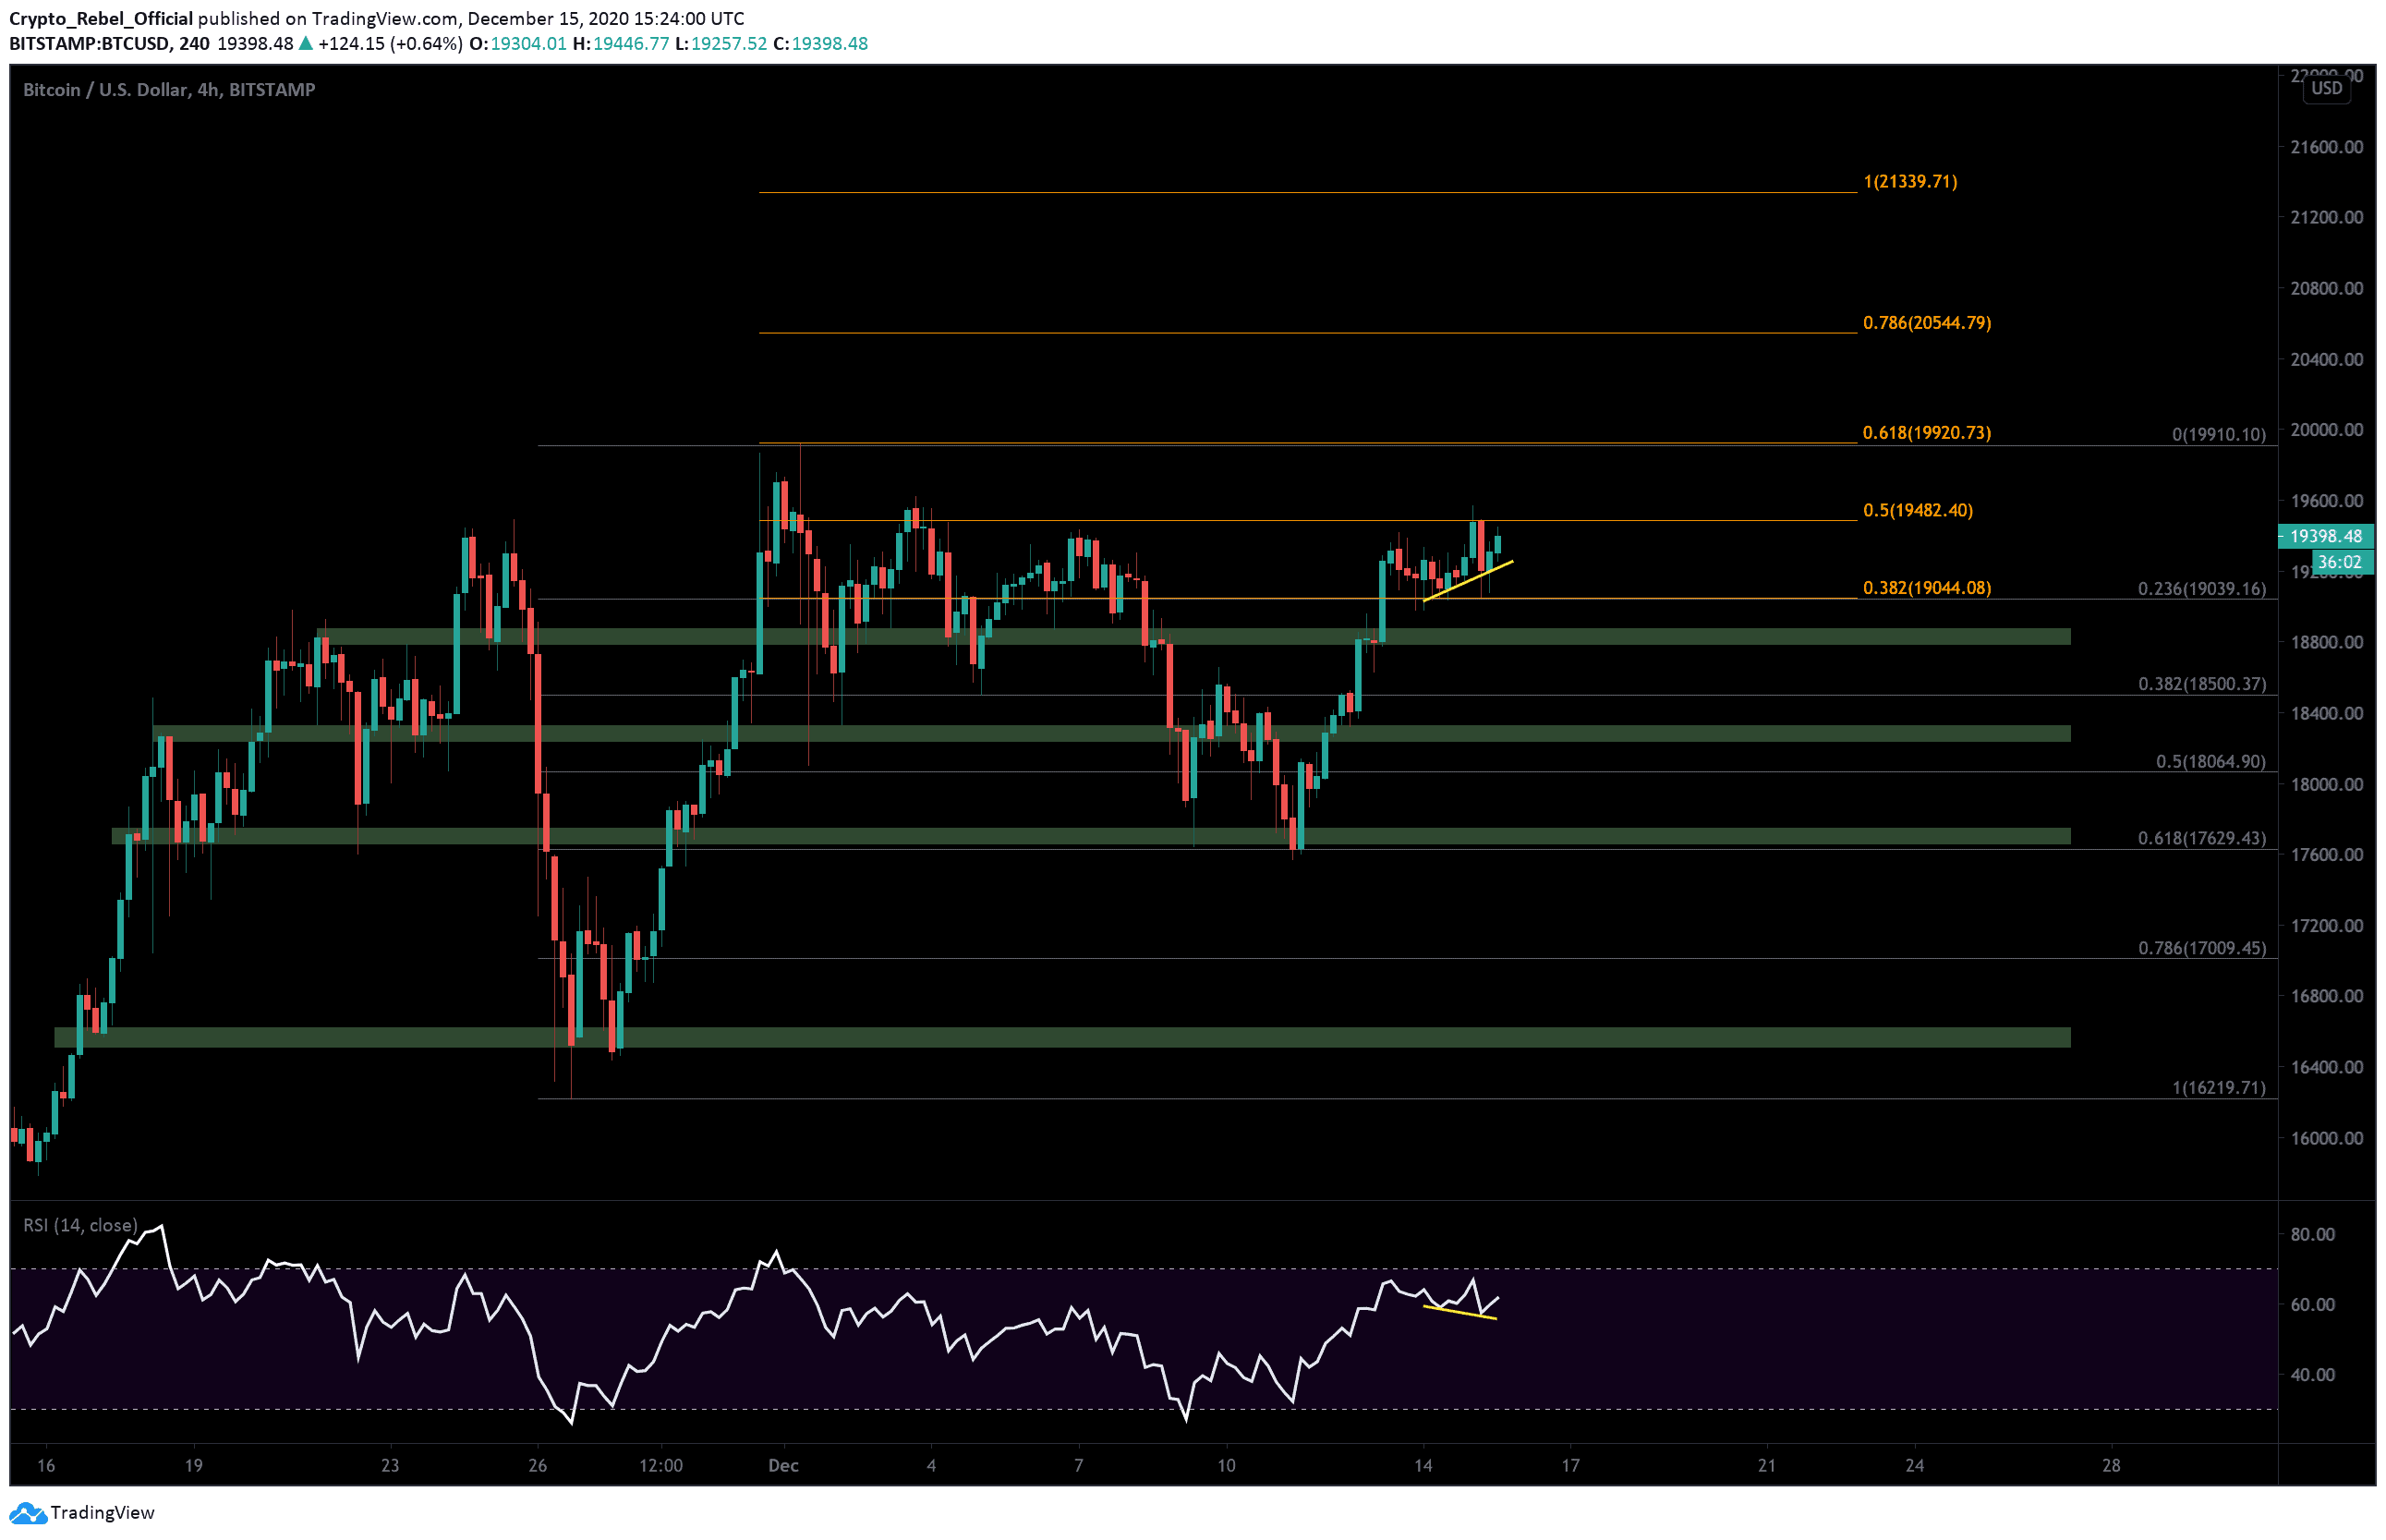
Bitcoin price has been oscillating within a narrow $450 range for the past 3 days now as bulls struggle to break over the 0.5 Fibonacci Extension level at $19,480. This area between $19,044 and $19,480 is the same spot that BTC was stuck inside of during December 5 – 8, right before prices tanked by $1,560.
According to Bitcoin’s volatility chart (BVOL24H), the leading crypto has fallen by almost 43% since December 9th, and the global crypto market capital has also started pushing sideways. This could be construed as a sign of accumulation before another big move or that traders are simply winding down in the run-up to Christmas.
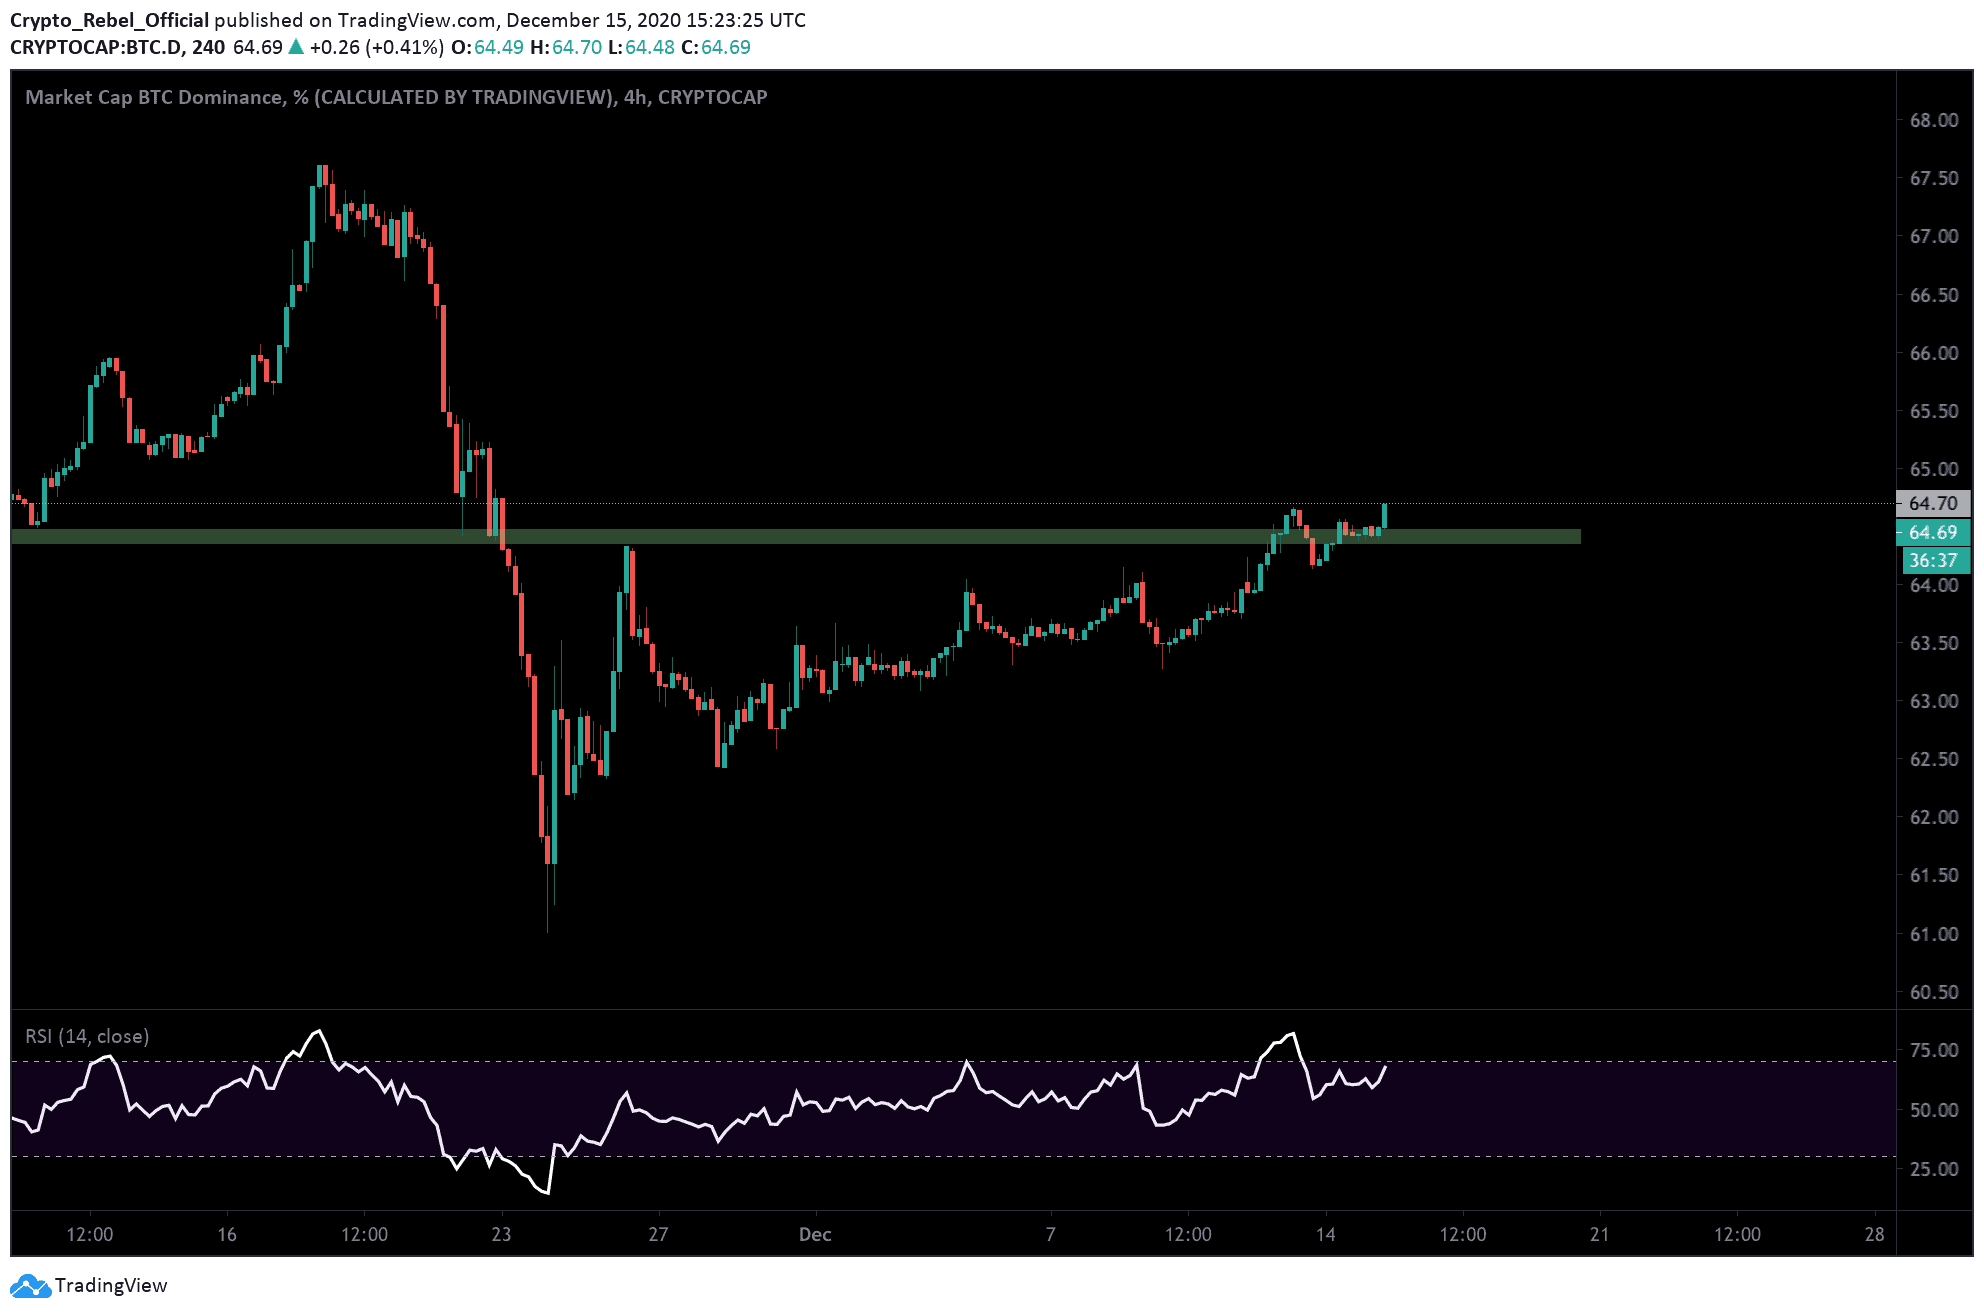
Despite these factors, Bitcoin dominance is now up at 64.7%, and testing levels not seen in over 22 days.
Price Levels to Watch in the Short-term
On the 4-hour BTC/USD chart, we will continue to watch the aforementioned range levels for any breakouts above or below.
It’s worth noting that there is a very subtle RSI divergence (yellow lines) in the current trend, with the indicator line printing a lower low while the price action sets a higher low. This seems to suggest that intraday momentum is favoring bearish traders despite BTC testing the $19.4K resistance at the moment.
If we see a breakout to the downside any time soon, then the $18,800 level will likely present our first area of support. From there, we have the key S/R level at $18,630, another support zone at $18,500, $18,300, and the psychological support at $18,000.
Above the current range resistance, the highest 4-hour close at $19,700 will likely be a key target for bulls to test in the short-term. The 0.618 Fibonacci extension level at $19,920 and the 0.786 Fibonacci extension level at $20,544 will also be critical levels to break above.
Total market capital: $574 billion.
Bitcoin market capital: $359 billion.
Bitcoin dominance: 62.7%
*Data by Coingecko.
Bitstamp BTC/USD 4-Hour Chart