BTC Consolidates Below $29K but is This the Calm Before the Storm? (BItcoin Price Analysis)
Bitcoin’s price has been consolidating between the 50-day moving average at $28,310 and the $30K resistance region. However, it seems likely to break out of this decisive range, determining its upcoming rally’s direction.
Technical Analysis
By Shayan
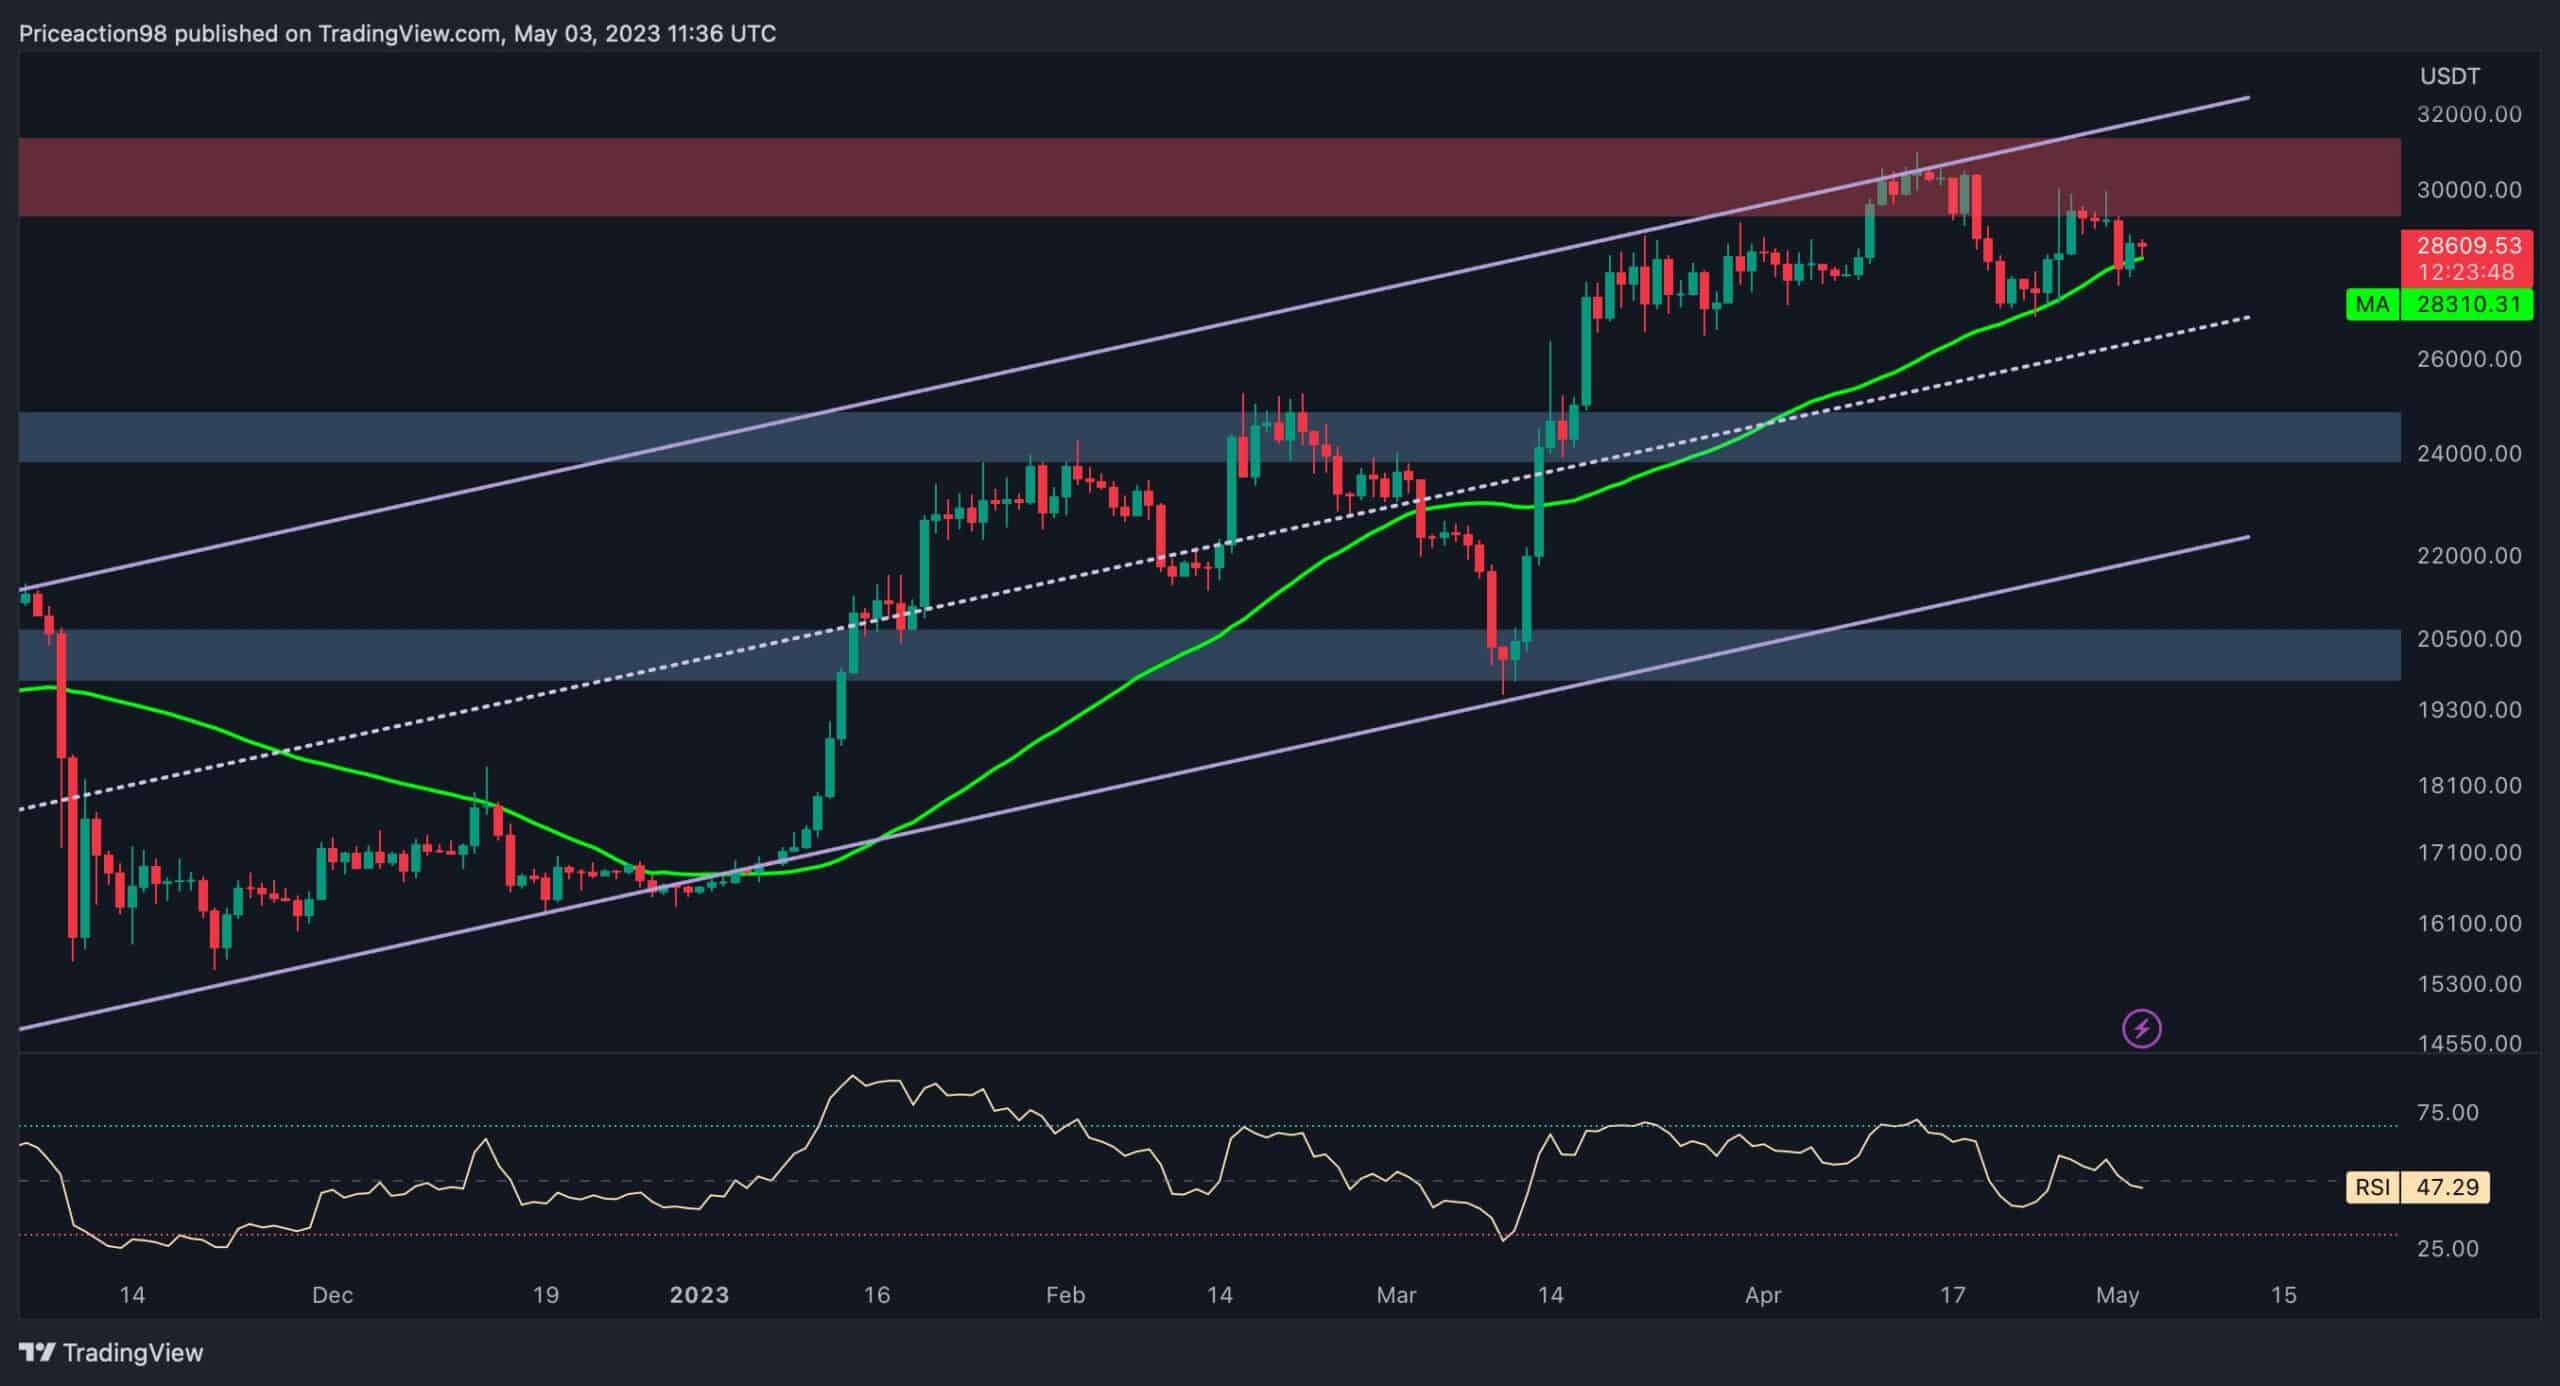
The Daily Chart
After finding support at the 50-day moving average of roughly $27K, the price started a steady uptrend, aiming to surpass the $30K region for the second time. However, Bitcoin failed to surpass this crucial resistance zone, resulting in a slight decline.
Nevertheless, the BTC price is currently consolidating within the tight range of the 50-day moving average at $28K and $30K.
A breakout beyond the $30K region will significantly impact market sentiment, as it is a crucial psychological resistance. Conversely, a decline below the 50-day moving average may result in volatility and consolidation in lower price ranges.
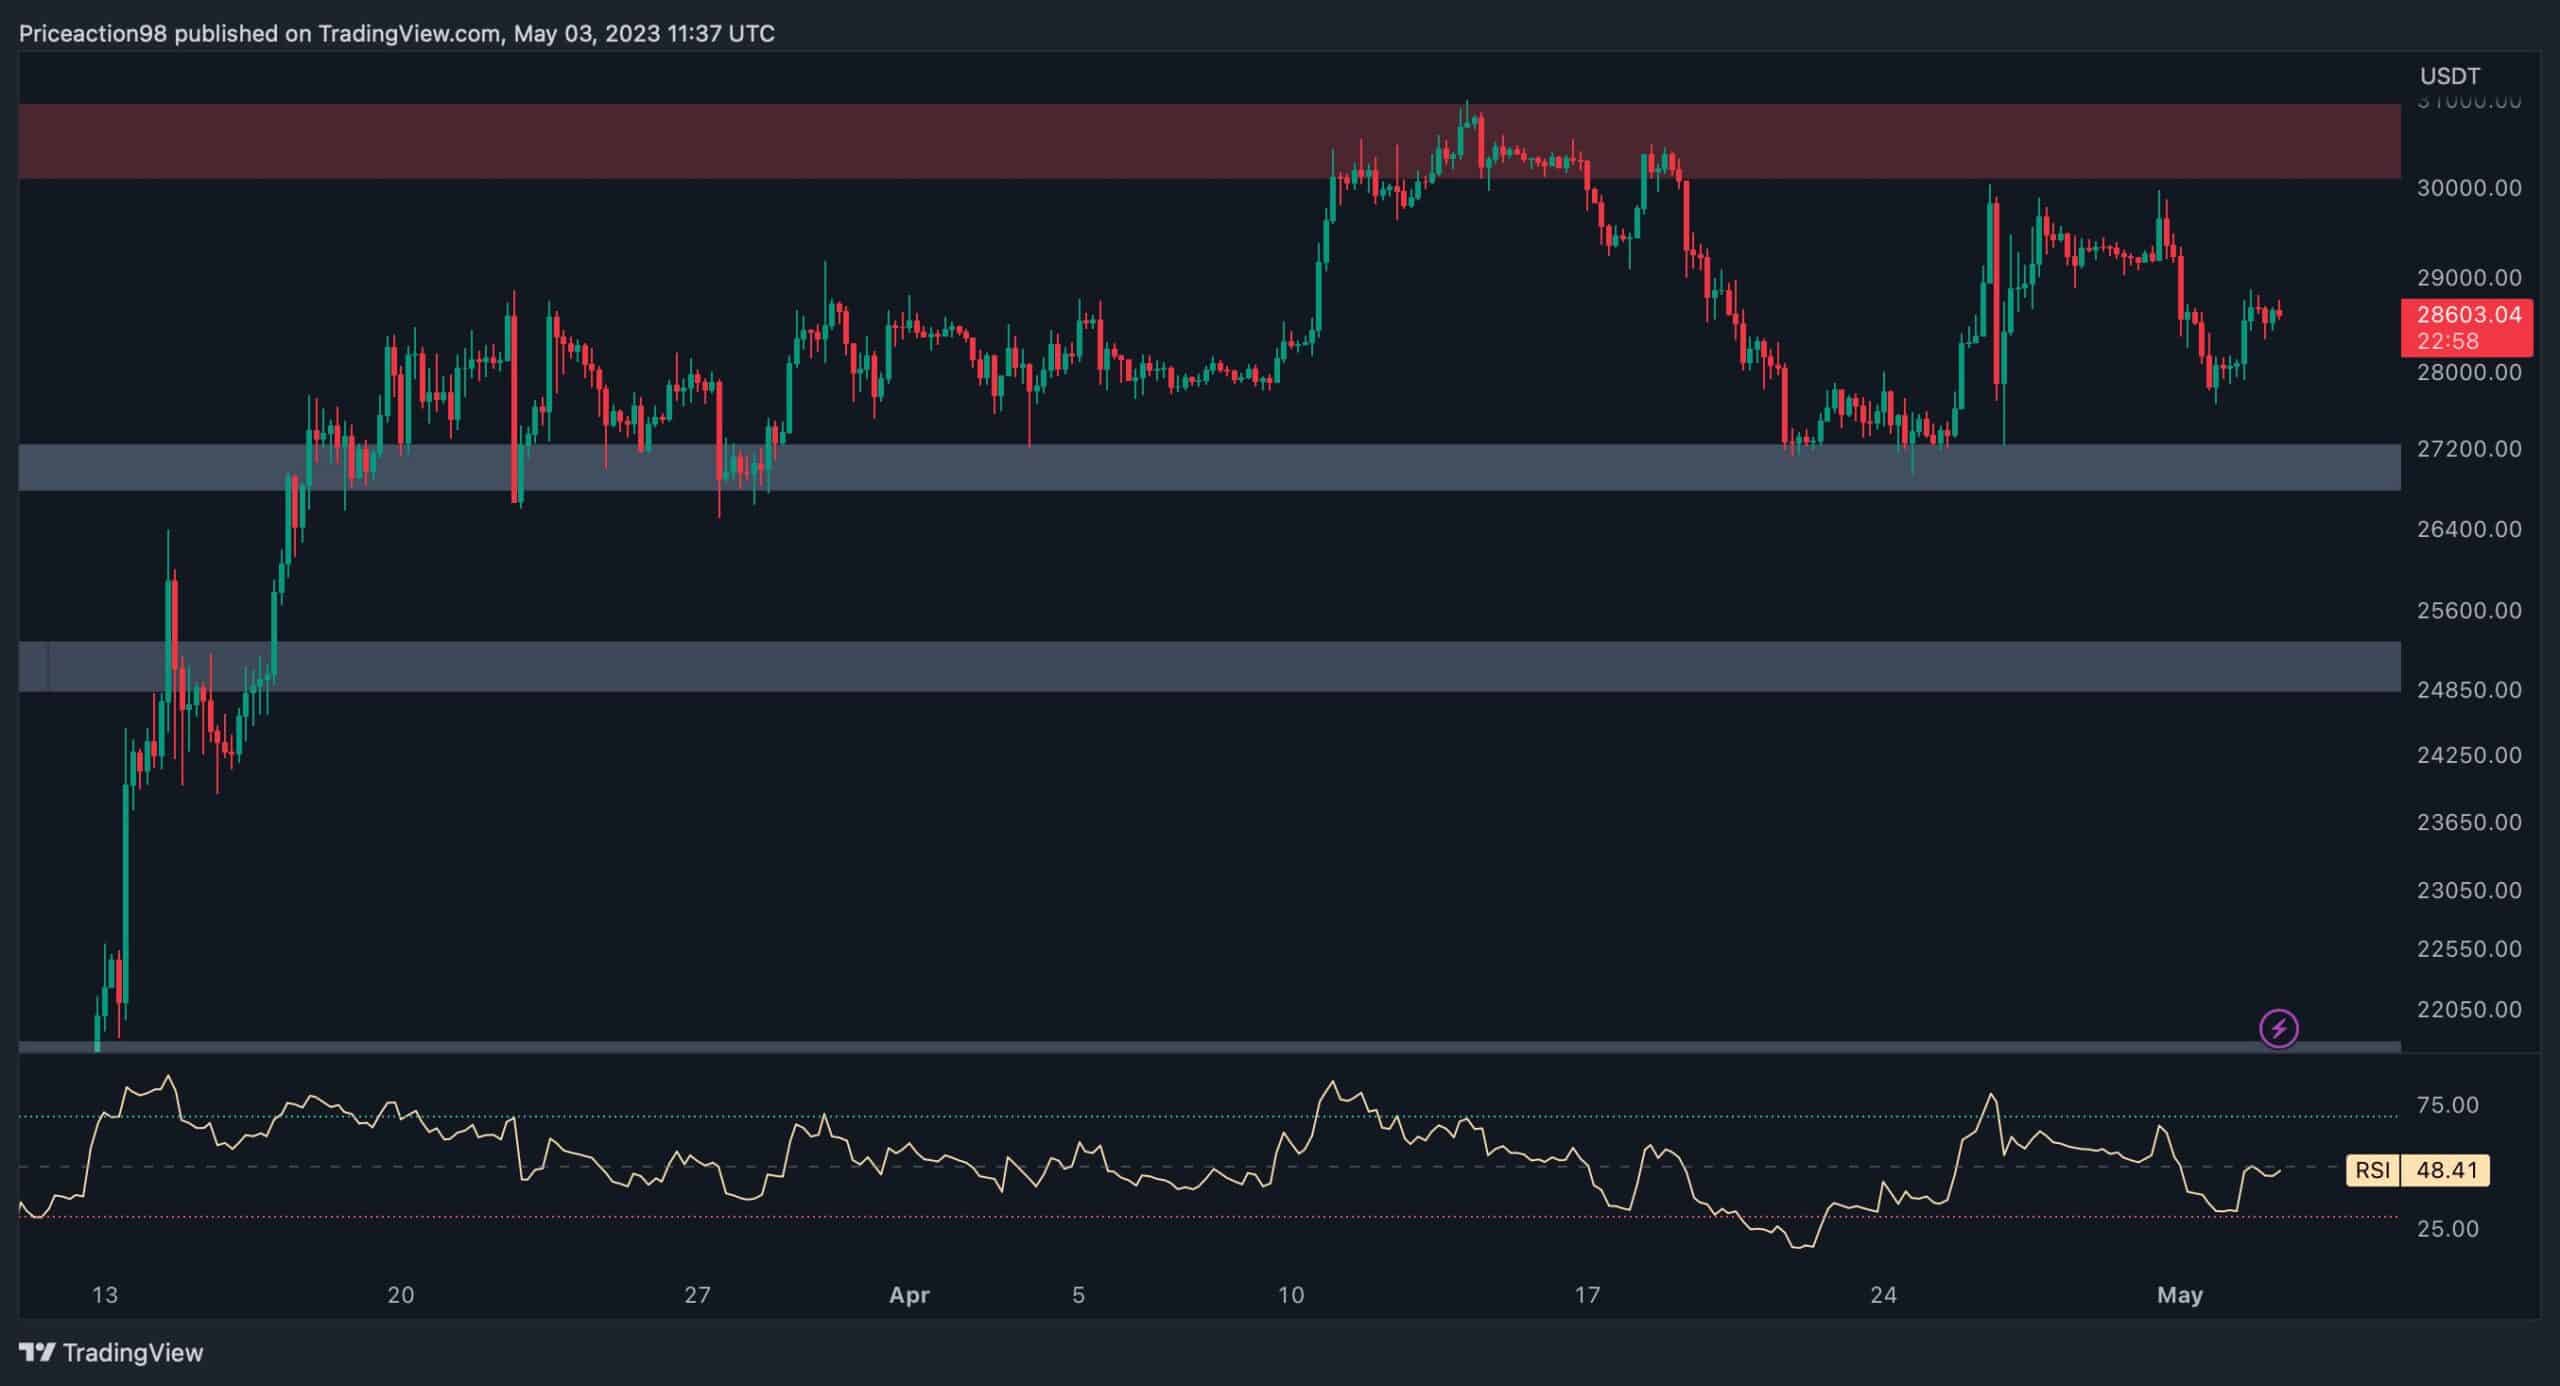
The 4-Hour Chart
Monitoring the 4-hour timeframe, it is apparent that the price has been stuck inside a static range between $30K and $27K. Recently, BTC experienced high volatility, resulting in big red and green candles without showing any clear sign of the overall market bias.
Ultimately, Bitcoin’s price is likely to break out of this range in the upcoming weeks, and the direction of the cryptocurrency’s following trend will heavily depend on the breakout’s direction. However, with the RSI indicator standing at the 50 mark, indicating a state of equilibrium between the bulls and the bears, BTC is expected to undergo a consolidation stage alongside volatility.
On-chain Analysis
By: Edris
Bitcoin’s price has been on the rise since rebounding from the $16K level a few months ago, leaving many investors hopeful that the bear market is finally over and a new bullish phase has begun. However, miners seem a lot more pessimistic.
This chart demonstrates the miners’ position index (MPI) metric, which displays the ratio of total miner outflow to its one-year moving average of total miner outflow. High values indicate mass selling by the miners, who are one of the most critical cohorts in the market.
The MPI has spiked recently, showing its highest values since January 2021, indicating that the miners have sold their coins at a significant rate near the recent highs. This could be considered a bearish signal, and if continued, their selling pressure could lead to a reversal and continuation of the bear market in the short term.

The post BTC Consolidates Below $29K but is This the Calm Before the Storm? (BItcoin Price Analysis) appeared first on CryptoPotato.