BTC Can Chart New All-Time High if it Breaks Above This Obstacle: Bitcoin Price Analysis
Crypto investors are over the moon as Bitcoin’s price is seemingly going toward a new record high after months of consolidation.
Yet, there’s still one last resistance level that should be broken.
Technical Analysis
By Edris Derakhshi (TradingRage)
The Daily Chart
On the daily chart, the asset has been rallying aggressively after breaking above the 200-day moving, located around the $64K level. Currently, the market is testing the key $69K resistance level, the sellers’ last resort, as a breakout would lead to a new all-time high and a potentially long-term rally for Bitcoin.
Yet, investors should be cautious, as the RSI is approaching the overbought region, which could result in a pullback.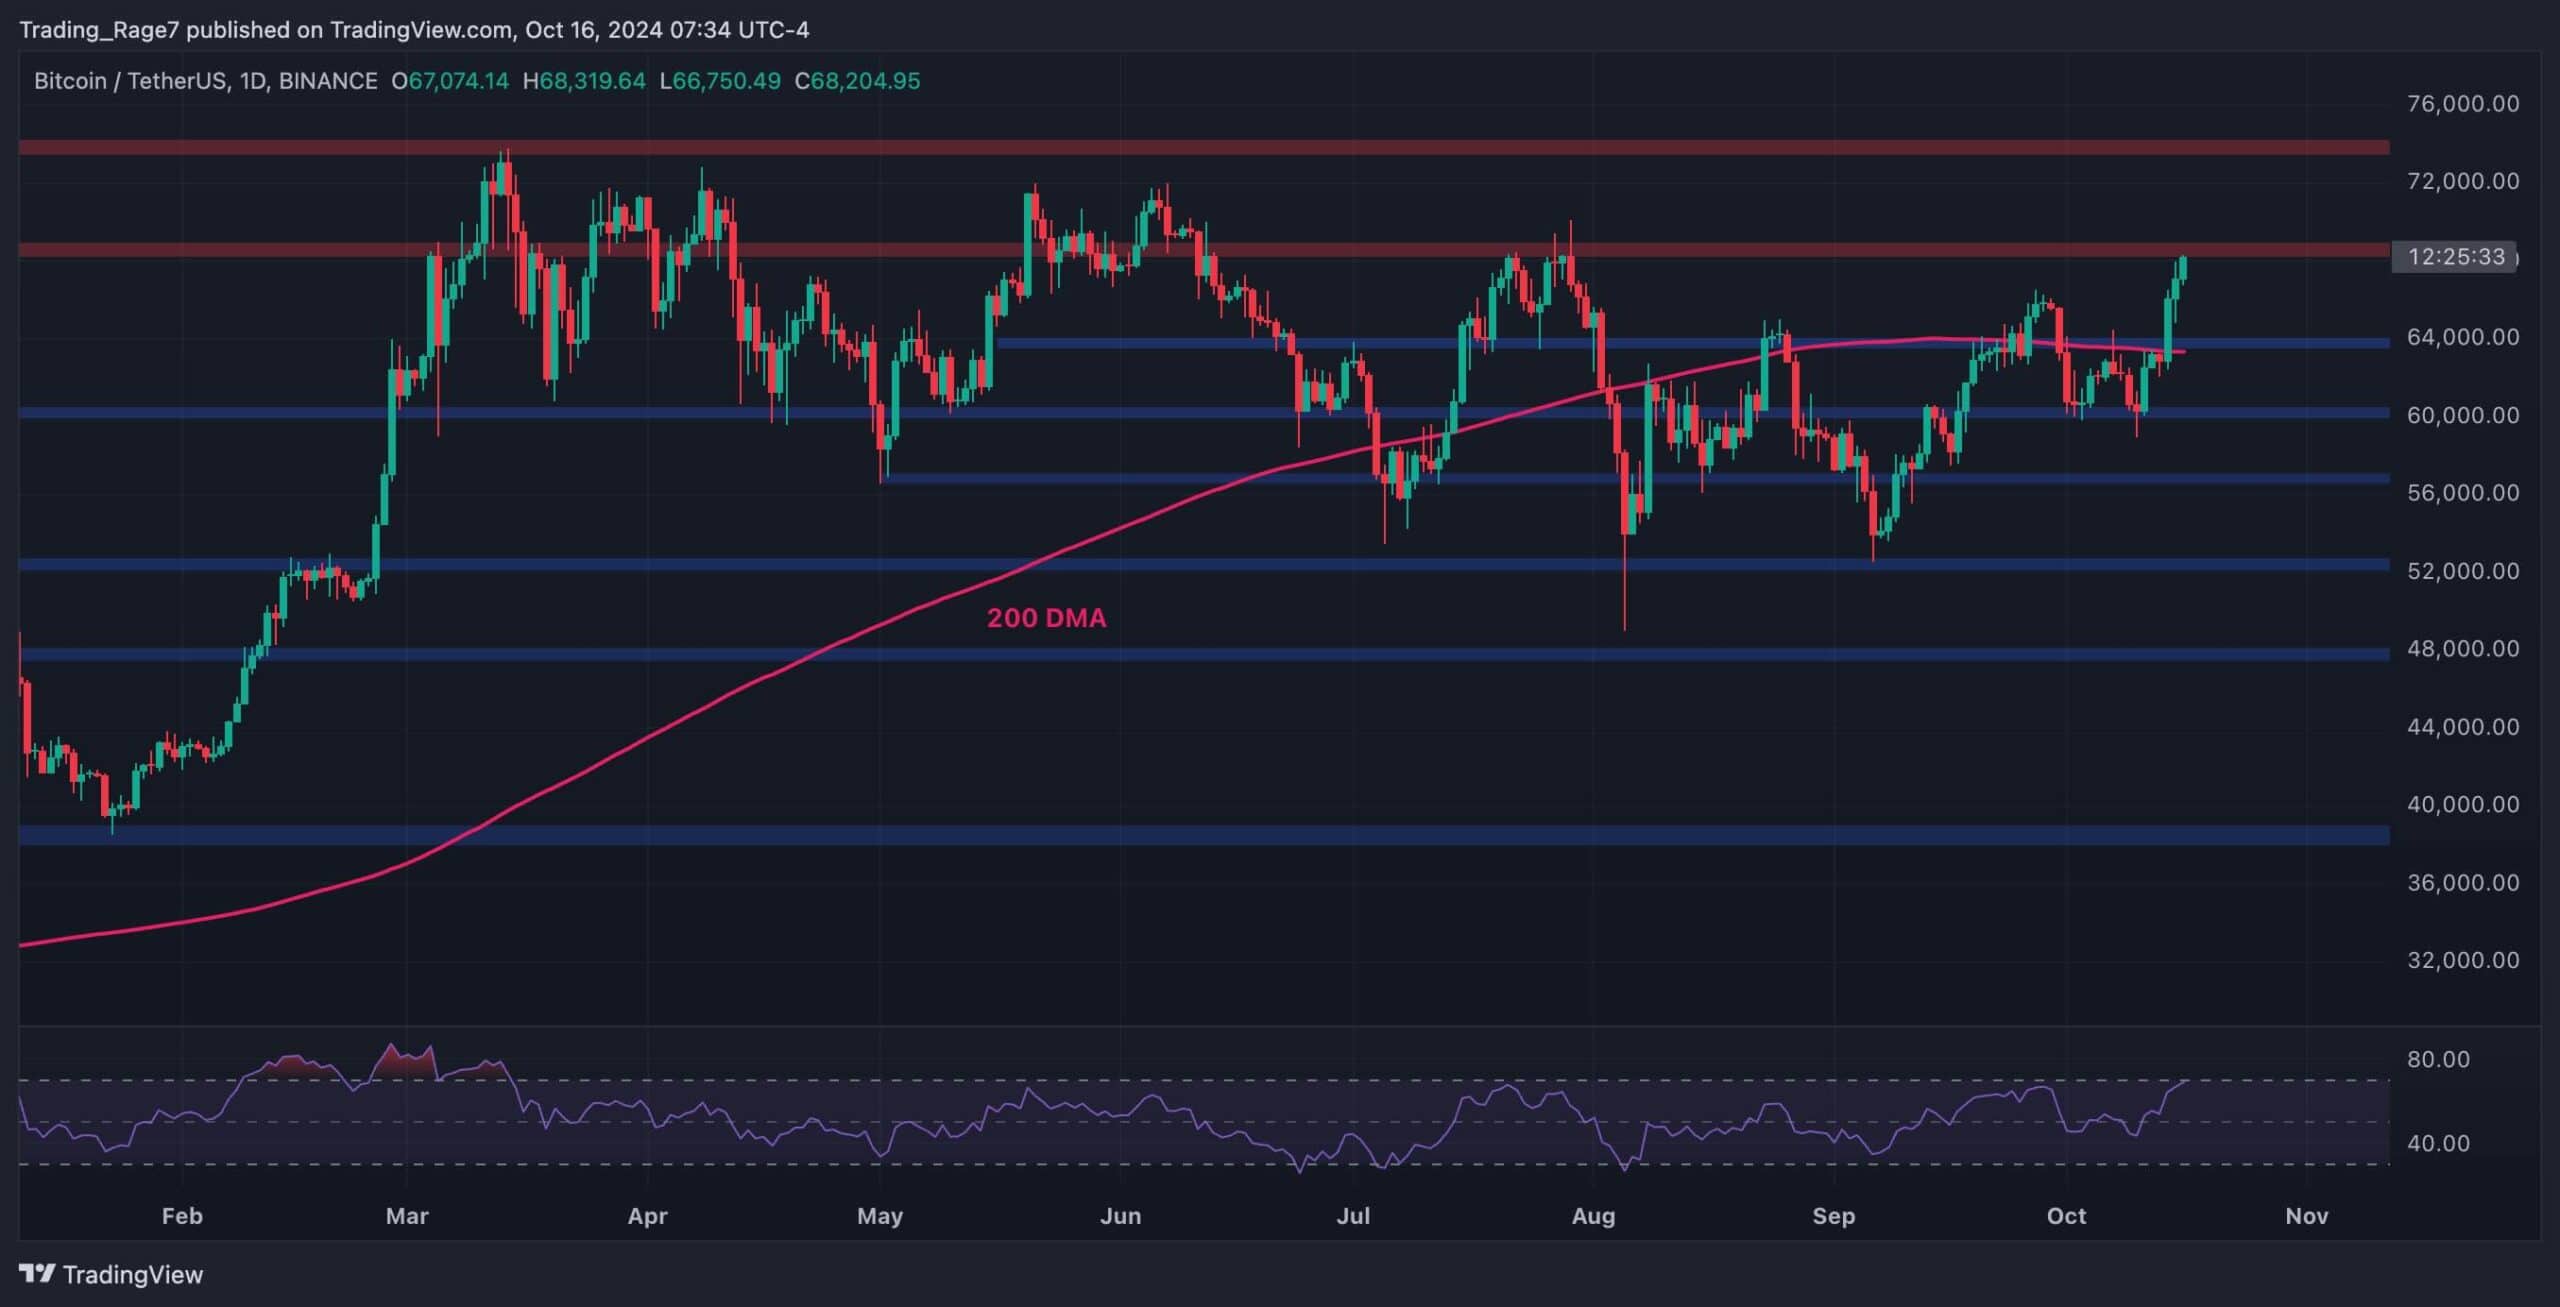
The 4-Hour Chart
On the 4-hour chart, the price has recently broken the large bullish flag to the upside. The $64K resistance level has also been broken through, as the market has reached the $69K resistance level. While the market structure is very bullish, the RSI shows overbought values.
This could cause concern, leading to a pullback or decisive rejection from the key $69K resistance level. Yet, a short-term pullback followed by a bullish continuation seems more likely.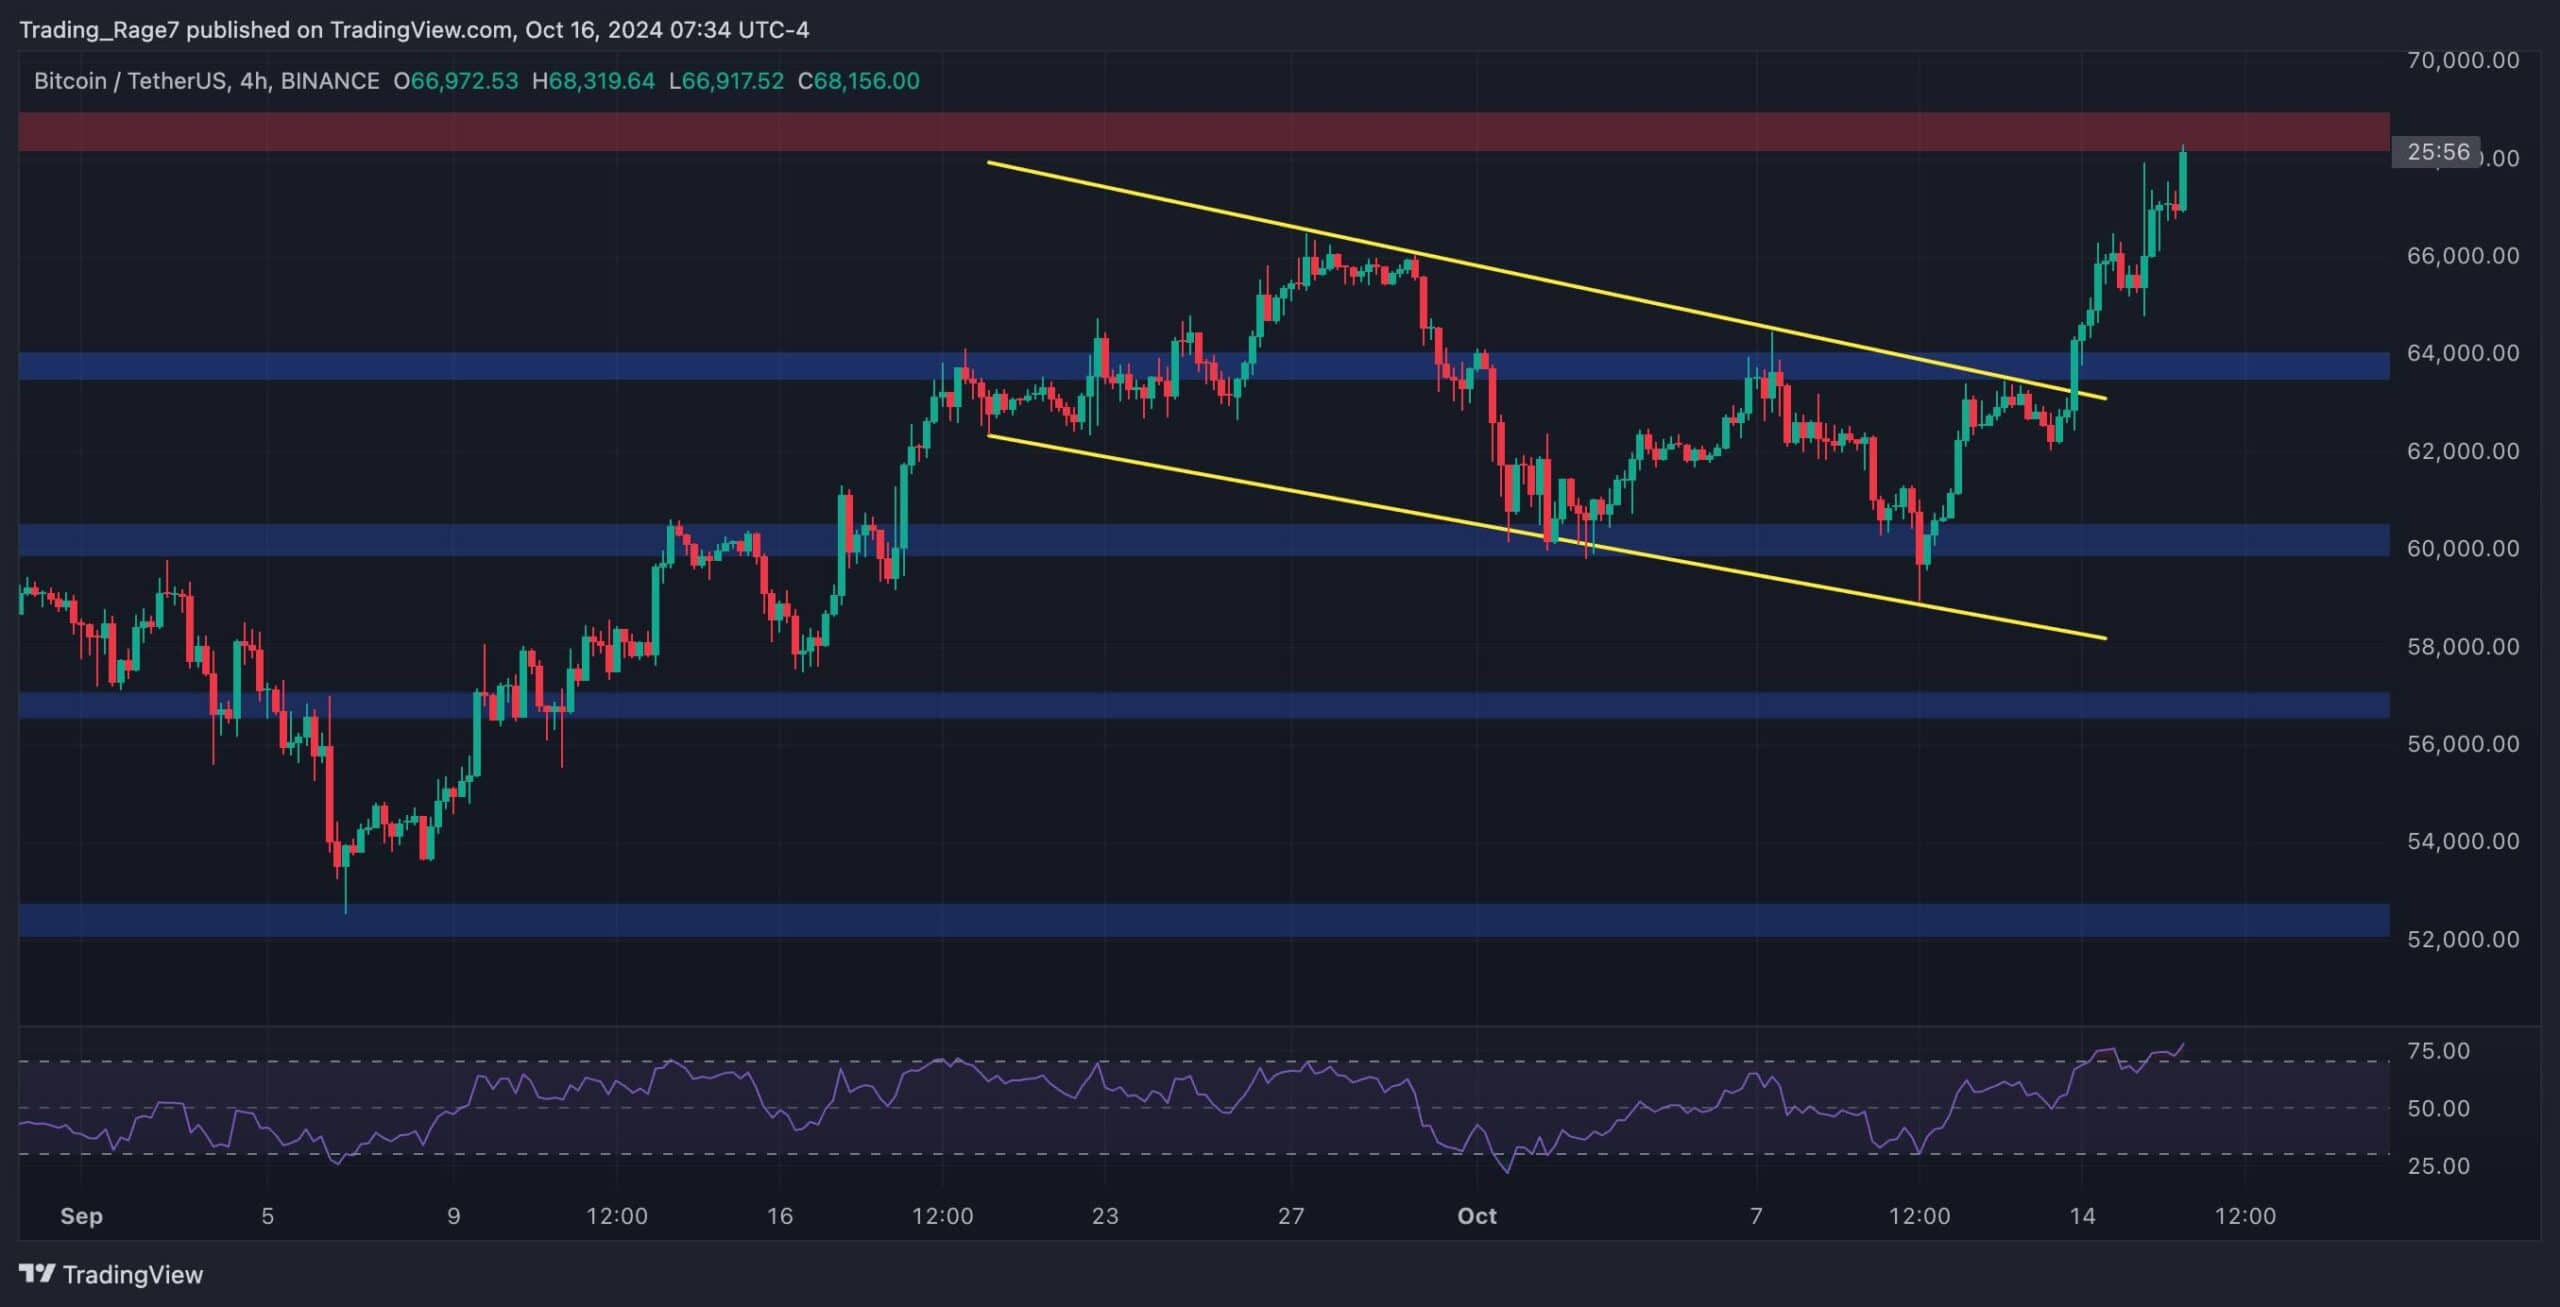
On-Chain Analysis
By Edris Derakhshi (TradingRage)
Bitcoin Short-Term Holder SOPR
As BTC is seemingly set to create a new all-time high, short-term market participants are again realizing profits. This conclusion has been drawn based on this chart, which demonstrates Bitcoin Short-Term Holder SOPR. Positive values indicate profit realization, while negative values show losses being realized.
As the chart suggests, after months of aggregate loss realization by short-term holders, they are finally beginning to take profits on aggregate, as BTC is appreciating. While this is a natural behavior in a bull market, it could lead to a correction if it leads to excess supply and selling pressure.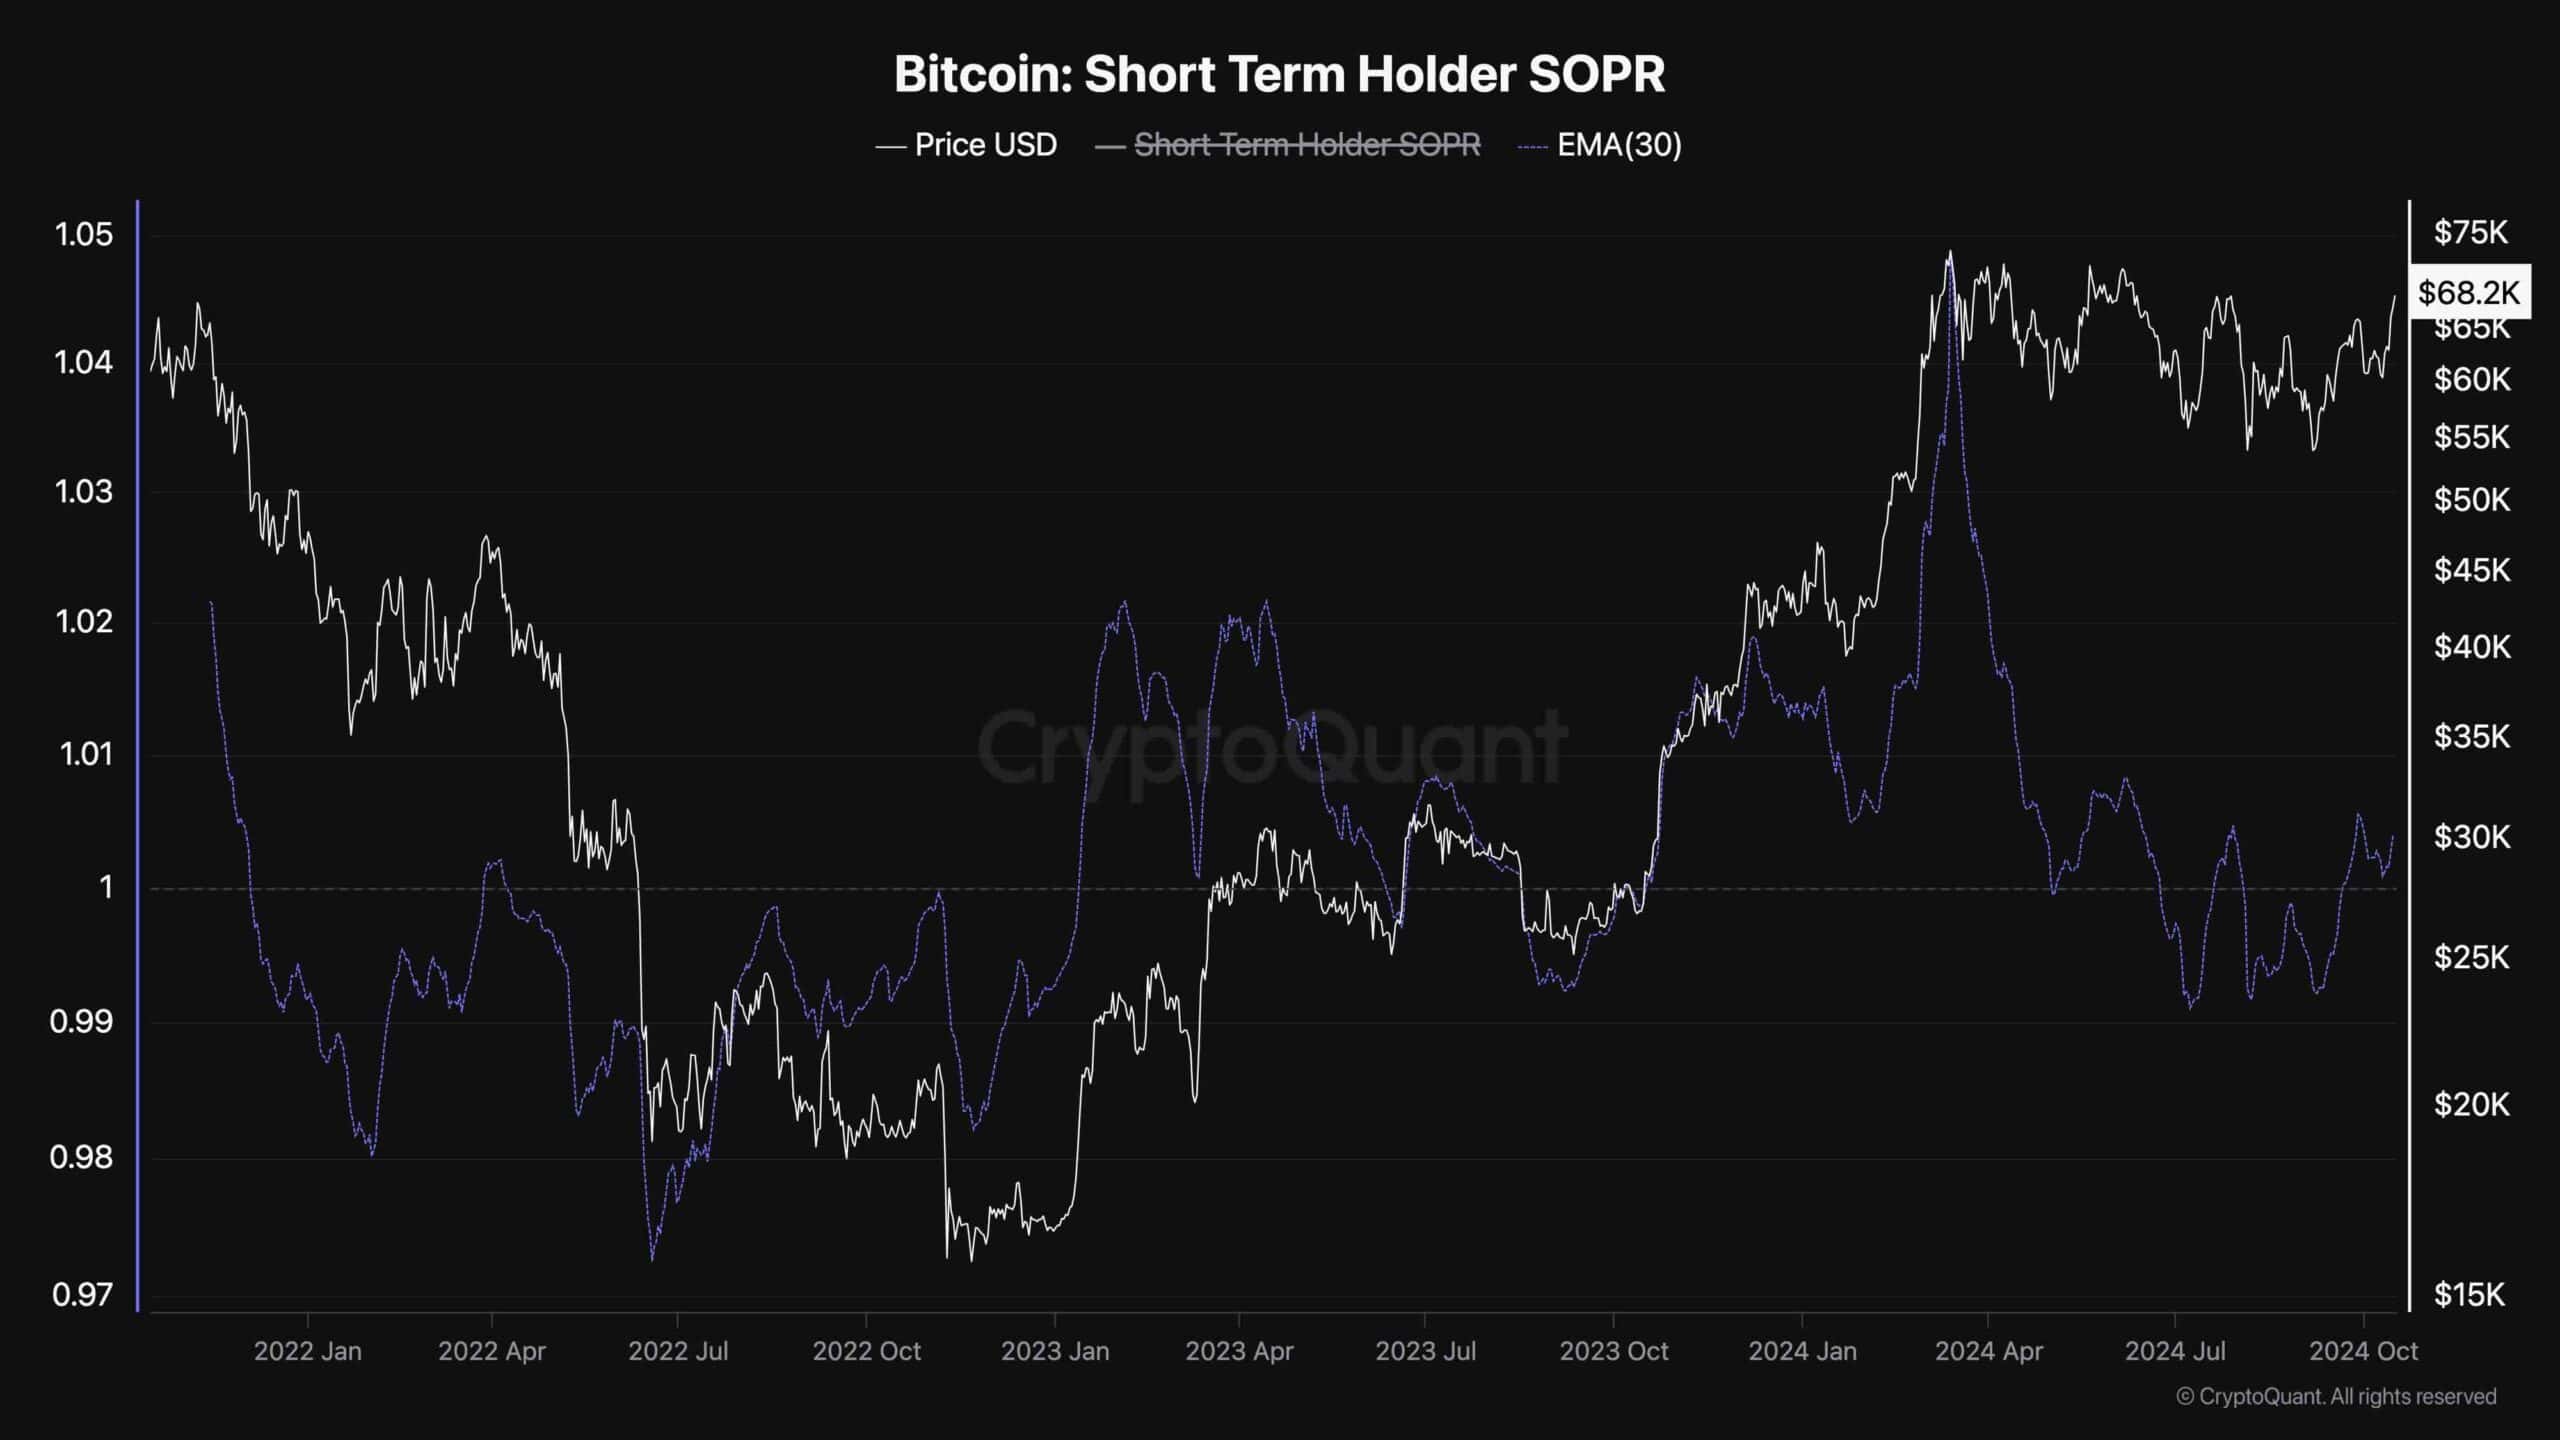
The post BTC Can Chart New All-Time High if it Breaks Above This Obstacle: Bitcoin Price Analysis appeared first on CryptoPotato.