Brewing Emerging Market Debt Crises
The U.S. dollar has risen to 20-year highs while the Japanese yen and the euro are acting like emerging market currencies. Are these crisis warning signs?

The below is an excerpt from a recent edition of Bitcoin Magazine Pro, Bitcoin Magazine’s premium markets newsletter. To be among the first to receive these insights and other on-chain bitcoin market analysis straight to your inbox, subscribe now.
DXY Annual Change Signals Crises Unfolding
As the Federal Reserve, who holds sole control over the monetary policy of the world reserve currency, continues to tighten monetary policy of the U.S. dollar, the global economy has begun to break as a result, being hit with a strong dollar and soaring commodity prices in tandem.
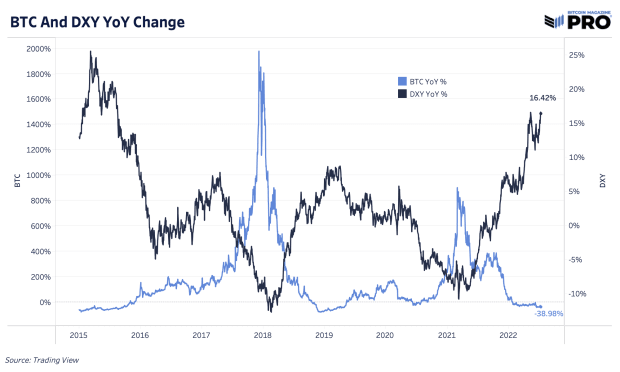
We can look to the U.S Dollar Index (DXY), which measures a weighted basket of fiat currencies against the dollar, which has soared to two-decade highs. Comparing the DXY year-over-year change with bitcoin, we can see clearly the market periods throughout bitcoin’s history that coincide with rising and falling dollar strength.

So while the adoption of bitcoin and cryptocurrency more broadly has its own native adoption curve, the cyclical bubbles and busts can be thought to be both enabled and then subsequently crashed by the ebbs and flows of central bank monetary policy dovishness and hawkishness.
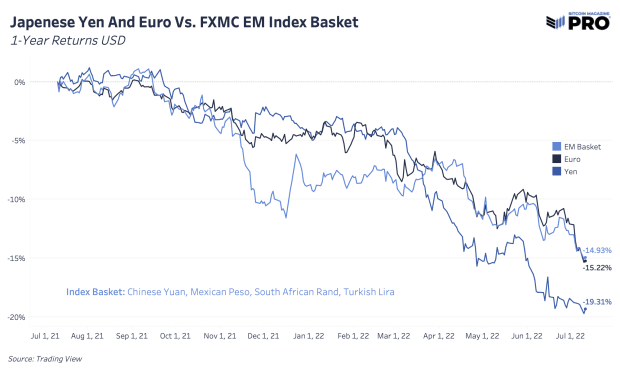
Turning our attention to Japan and Europe, both the Japanese yen and euro are behaving like emerging market currencies. The two majors have lost more in value against the dollar over the last year than the FXMC emerging markets index basket consisting of the Chinese yuan, Mexican peso, South African rand and Turkish lira. Of the equally-weighted basket, the yuan and peso have lost 3.5% and 3.8% respectively over the last year while the rand has lost 15.7% and the lira has fallen nearly 50%.

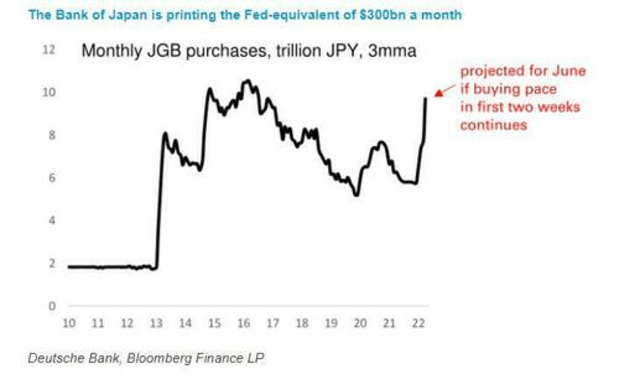
The structural imbalance with the euro and the yen are due to both the EU and Japan being large importers of energy, while their central banks, the ECB and the BoJ respectively, continue to aggressively debase their currency with various forms of yield curve control.
The irony is that the world’s second and third largest currencies are not in fact emerging markets, but rather developed economies that now have a massive shortage of energy and real commodities that cannot be solved with a central bank money printer. The currencies are collapsing as a result of this imbalance.
Incoming Emerging Market Debt Defaults
According to Bloomberg, there is nearly a quarter trillion dollars worth of emerging market debt that is trading in distress accounting for approximately 17% of all emerging market debt denominated in dollars, euros or yen.
As bitcoin/cryptocurrency natives know all too well in recent months, the default of one counterparty is only isolated in theory, and in practice the second/third order effects are seemingly impossible to know beforehand.
In regards to El Salvador’s bitcoin adoption, the nation has only purchased $38 million worth of bitcoin, and given citizens the option to use either BTC or USD as a tax-free legal tender, which is a pittance compared to the $800 million worth of dollar debt owed on its bonds in 2025.
The key thing to understand is that in a debt-based monetary system, a debt crisis is essentially a short squeeze. Specifically in regards to the dollar, despite the gigantic amount of stimulus supplied throughout 2020 into 2021, a structural shortage of dollars exists due to the construction of the international monetary order.
There may have been and may still be a surplus of dollars, but the massive implicit short position around the world creates a supply/demand imbalance; a shortage of dollars. The response is that dollar-denominated assets are sold to cover positions on dollar liabilities, which creates a feedback loop of falling asset prices, declining liquidity, debtor creditworthiness, and increasing economic weakness.
Bitcoin is absolutely scarce, but has no structural shortage built into the system. During a credit unwind, bitcoin sells off as people rush for dollars to cover their short positions (debts).
To quote our March 7 issue,
“It would be wise to warn our readers that despite being extremely bullish on bitcoin’s prospects over the long term, the current macroeconomic outlooks looks extremely weak. Any excessive leverage present in your portfolio should be evaluated.
“Bitcoin in your cold storage is perfectly safe while mark-to-market leverage is not. For willing and patient accumulators of bitcoin, the current and potential future price action should be viewed as a massive opportunity.
“If a liquidity crisis is to play out, indiscriminate selling of bitcoin will occur (along with every other asset) in a rush to dollars. What is occurring during this time is essentially a short squeeze of dollars.
“The response will be a deflationary cascade across financial markets and global recession if this is to unfold.”
Final Note
The contagion that has occurred in recent months in cryptocurrency markets may have been just a taste of what is to come next in traditional financial markets. Despite bitcoin being nearly 70% from its all-time highs, bitcoin is currently treated as a high beta asset to legacy market liquidity dynamics, and if the worst is yet to come in regards to deleveraging and further volatility in the traditional markets, bitcoin does not exist in a vacuum. It will be subject to the global flight to dollars during a major risk-off event.


