BNB Tumbles 5% Weekly, Now Facing Critical Support (Binance Coin Price Analysis)
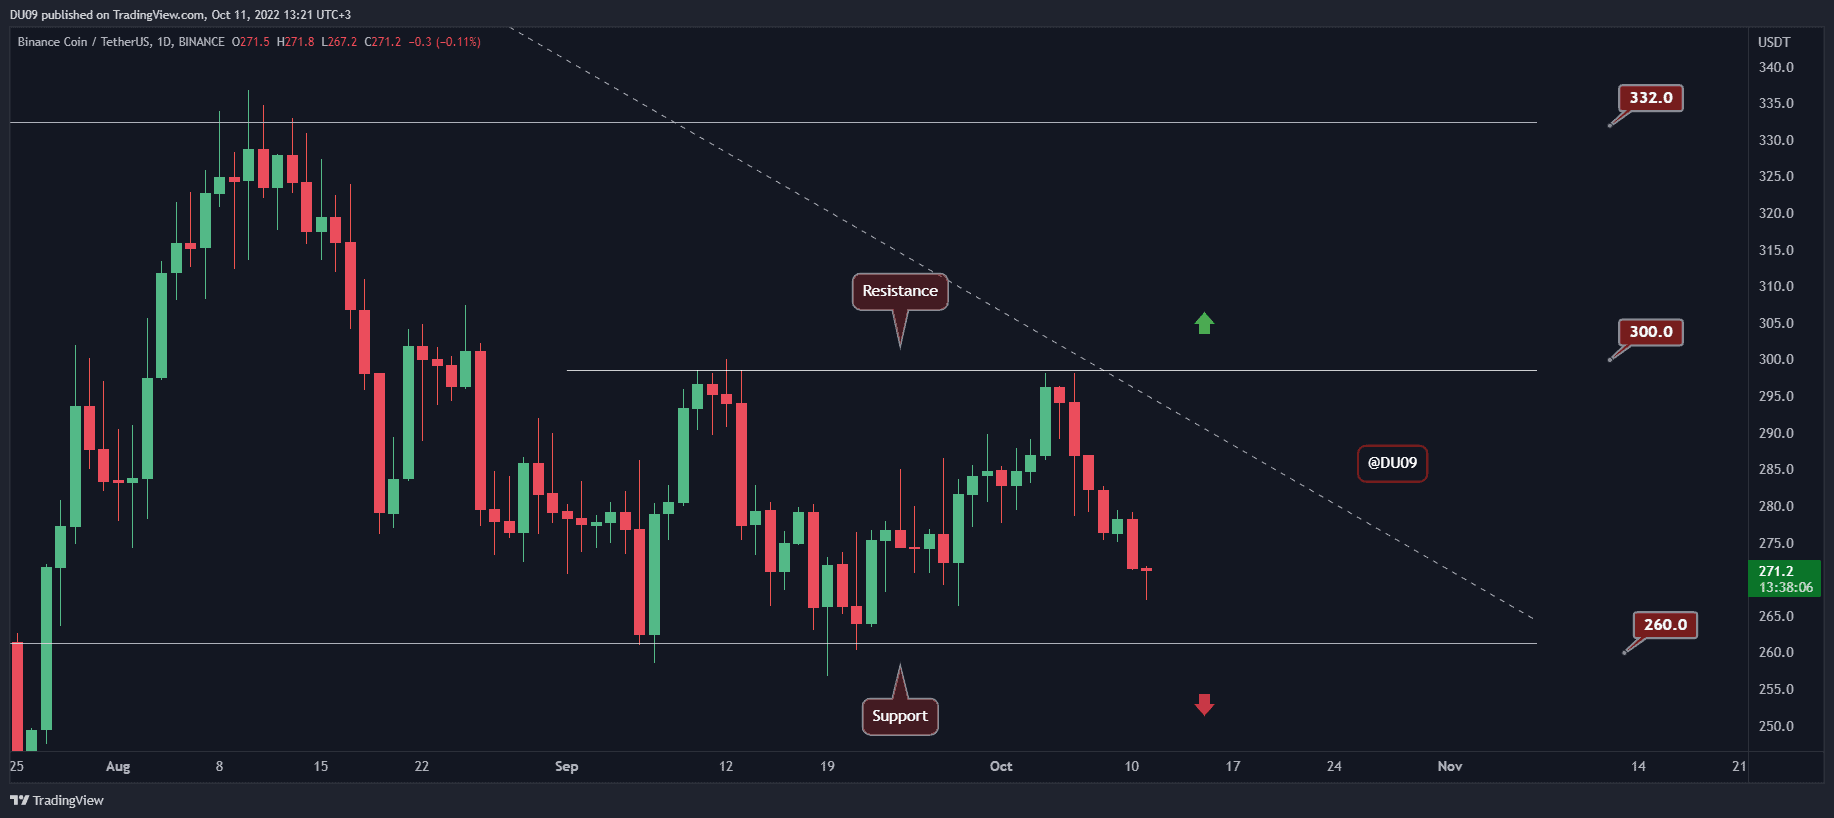
Binance Coin had a difficult week after being rejected at the key resistance and entered into a downtrend.
Key Support level: $260
Key Resistance level: $300
BNB could not move above the $300 resistance, and since then, the bears took over. The next key support is found at $260, and if buyers don’t step up, then the price is likely to retest this level. Considering the decreasing volume, it seems unlikely that buyers will become interested until the price hits $260.

Technical Indicators
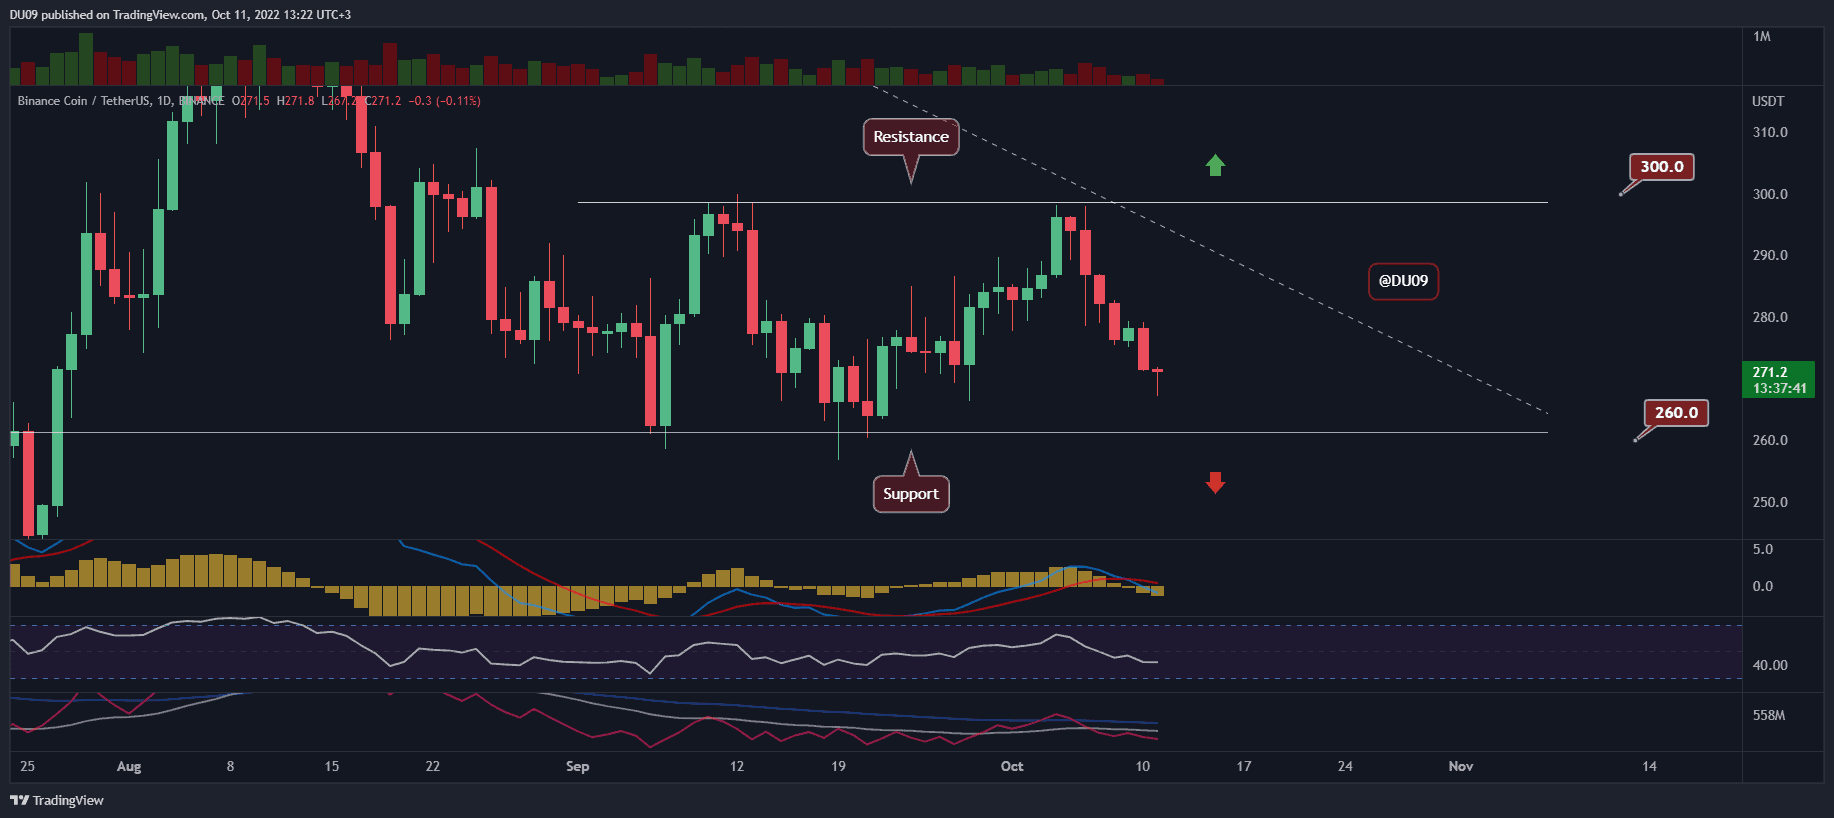
Trading Volume: The volume continues to decrease as the price falls. This could be interpreted as bullish, and there is a good chance that buyers may return at the key support to reverse the current downtrend.
RSI: The daily RSI fell under 50 points and continues to fall with lower lows and lower highs. This is bearish.
MACD: The daily MACD turned bearish two days ago, and this is a significant change in the price action, which could mean that this downtrend will continue for some time.

Bias
The current bias is bearish.
Short-Term Prediction for BNB Price
Buyers will soon be faced with the difficult task of defending BNB at the key support of $260. The sellers currently command the price action, and it’s important to see how the cryptocurrency will perform at the abovementioned support level.
The post BNB Tumbles 5% Weekly, Now Facing Critical Support (Binance Coin Price Analysis) appeared first on CryptoPotato.


