BNB Surpassed $20, The Highest Price Since January 2018: Binance Coin Price Analysis April 18
Binance Coin (BNB) has finally broken above the elusive $20 resistance level in early today’s trading after rising by 6% over the past 24 hours. The coin is currently trading around a price of $20.70 after the cryptocurrency has seen a 30% monthly price surge.
Within the top 10 ranked projects by market-cap, Binance Coin remains the most serious performer over the past 90 days, after rising by an extraordinary 217%. The coin is now 20% from its all-time high at $25.
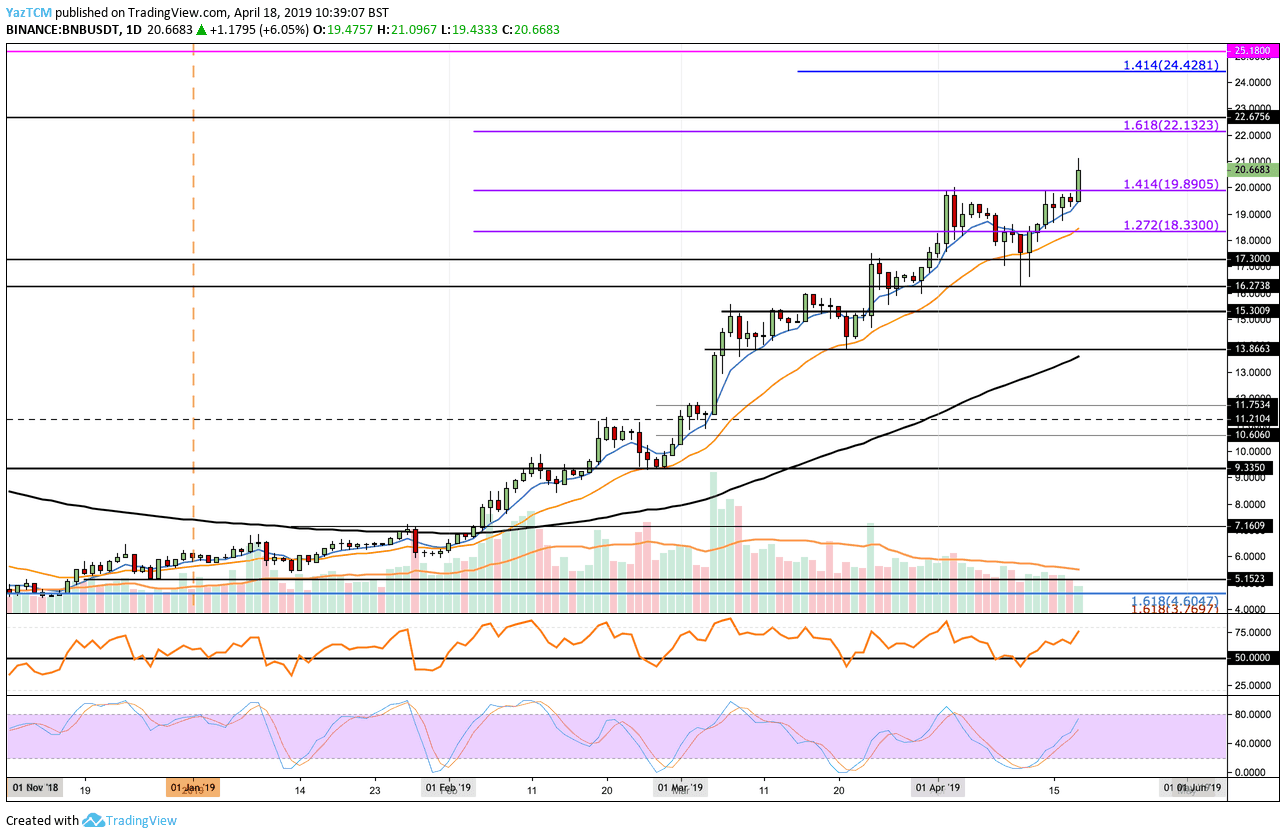
Looking at the BNB/USD 1-Day Chart:
- Since our previous BNB/USD price analysis, we can see that BNB/USD has managed to break above the resistance at $19.89 – $20 where lies a 1.414 Fibonacci Extension level.
- From above: The nearest level of resistance now lies at $21.00. Further resistance then lies at $22.13, along with a 1.618 Fibonacci Extension level. If the buyers continue above $23.00 and $24.00, we can then assume more resistance above at $24.42 followed by higher resistance at the previous ATH at $25.18.
- From below: The closest support now lies between $20.00 and $19.89. Below lies $19.00, $18.33, $17.30 and $16.27.
- The trading volume is close to the average level, not significant at this time.
- The RSI has recently bounced back above the 50 levels as the bulls remain in control of the market momentum. The Stochastic RSI had also recently initiated a crossover above which had signaled that BNB might break the $20 resistance level.
Looking at the BNB/BTC 1-Day Chart:
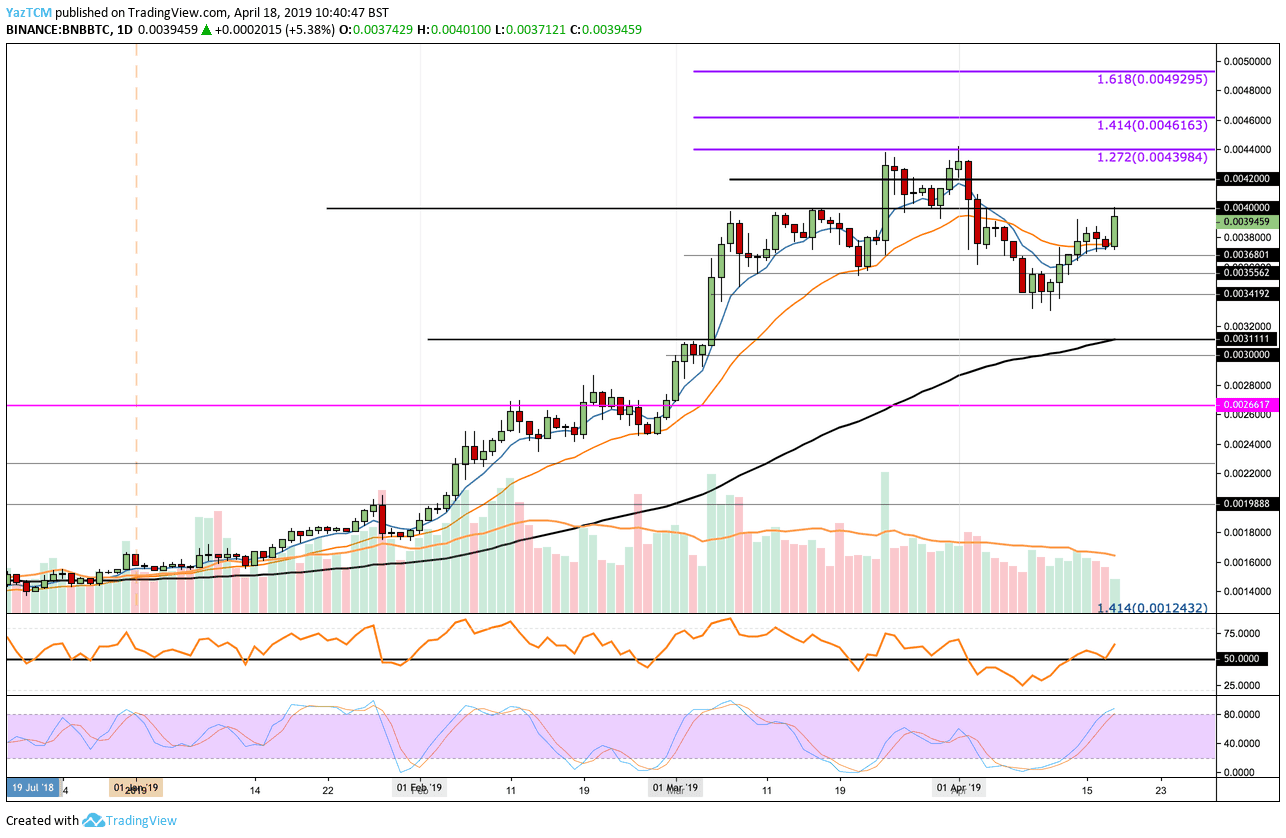
- Following our previous analysis, we can see that BNB/BTC has continued to climb higher and has recently reached the resistance at the 0.004 BTC level.
- From above: The nearest level of resistance now lies at 0.0042 BTC which is closely followed with further resistance at 0.0044 BTC (the Bitcoin’s all-time high). Above 0.0044 BTC, higher resistance lies at 0.0046 BTC (1.414 Fib Extension) and 0.004930 – 0.005 BTC (1.618 Fib Extension).
- From below: Initial support lies at 0.003680 BTC. Support below this is located at 0.003420 BTC and then at 0.003111 BTC which is further bolstered by the 100-days moving average line.
- The Stochastic RSI looks to be positioned to initiate a crossover below signal which could stall BNB/BTC progress. However, the RSI has recently bounced back above 50 which indicate that the bulls have regained momentum.
The post BNB Surpassed $20, The Highest Price Since January 2018: Binance Coin Price Analysis April 18 appeared first on CryptoPotato.