BNB Price Analysis: Can Binance Coin Recover Following a Drop To 25% Below It’s All-time High?
The Binance Coin surge has shown some signs of slowing down over the past seven days after the cryptocurrency has dropped by a total of 4.5%, and earlier today, reached a low of 0.00331 which is 25% decrease from BNB’s Bitcoin’s all-time high value. Nevertheless, the cryptocurrency has still seen an impressive 90-day price increase which totals over 170%, bringing the price for the cryptocurrency up to roughly $17.88. Binance is now in 7th place on the top cryptocurrencies by market-cap value as it holds $2.54 billion.
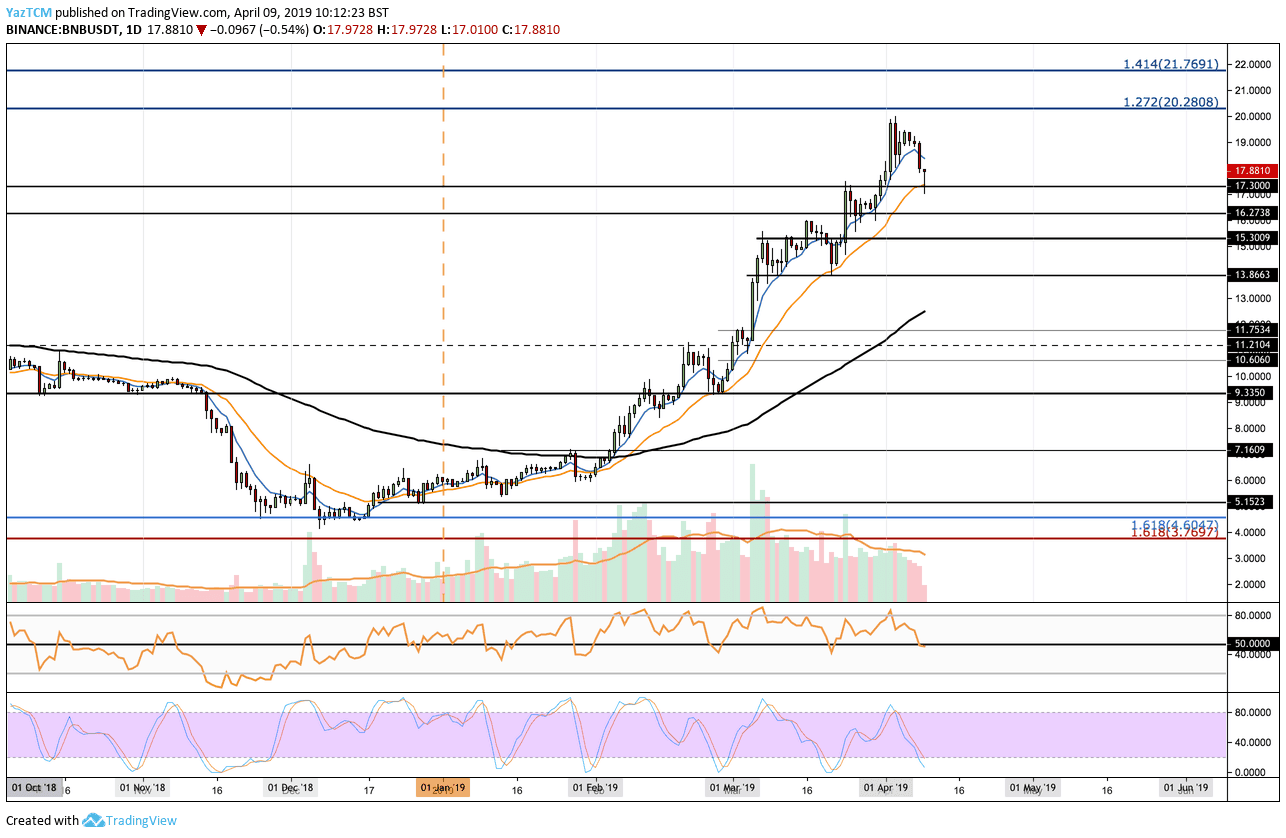
Looking at the BNB/USD 1-Day Chart:
- Since our last BNB/USD price analysis, we can see that BNB had continued to rise past resistance at the $17.30 level and has managed to reach the $20 level before the market rolled over and got rejected. Binance Coin is now trading back above the $17.30 support level.
- From above: The nearest level of resistance now lies at $18.00 and $20.00. If the buyers can break above $20.00, further resistance then lies at $21.76 which contains a long term 1.414 Fibonacci Extension level. Above $21.76, more resistance then lies at $23.90.
- From below: The nearest level of support now lies at $17.30. Beneath this, we can expect further support at $16.27, $15.30 and $13.90.
- Stochastic RSI oscillator is showing that the market may be reaching oversold conditions as we wait for the cross-over above to confirm this. If the Stochastic RSI can cross soon, and the RSI remains above 50, we can expect the bullish correction for BNB.
- The trading volume is decreasing during the past days, which could turn into a bullish sign for the buyers (a healthy rising trend means high volume of green days, low volume of red days).
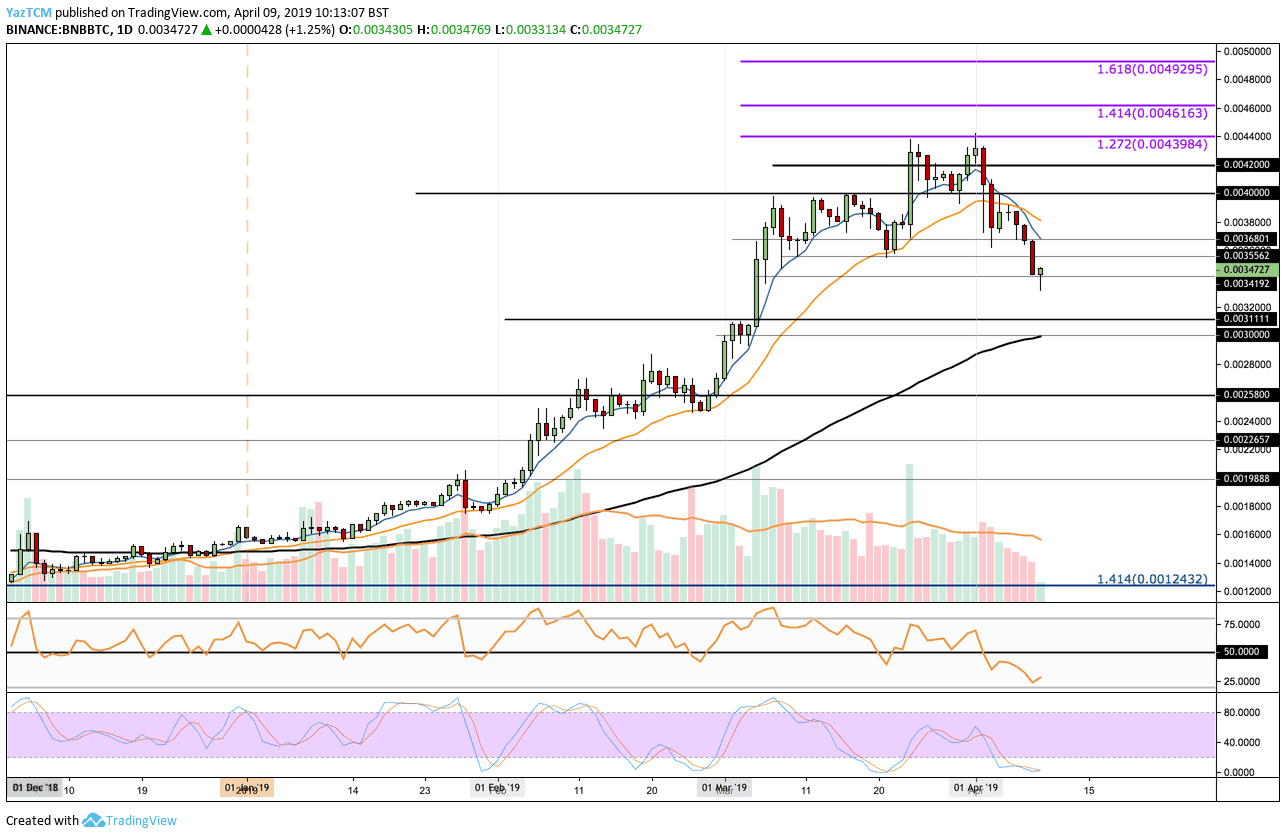
Looking at the BNB/BTC 1-Day Chart:
- Following our previous BNB/BTC analysis we can see that the coin had failed to break above the all-time high resistance zone at 0.004400 BTC. The market had attempted to break above but double topped (a bearish sign) at this level of resistance and rejected. Price action is now trading above support line of 0.00341 BTC.
- From above: The nearest level of resistance lies at 0.003680 BTC. Above this, further resistance is expected at 0.0040 BTC and 0.0042 BTC. If the bulls continue above, additional resistance then lies at 0.0044 BTC. Higher resistance above 0.0044 BTC is located at 0.0046 BTC and 0.0050 BTC.
- From below: The nearest level of support is at the current level of 0.00341 BTC. If the sellers break below, further support is at 0.003 – 0.0031 BTC area (current daily low). The support at 0.0030 BTC is considered strong followed by the 100-day moving average.
- The Stochastic RSI has suggested that the bulls could regain control following a cross over above at the oversold area. The RSI is within the bearish territory, but it if it can break back above 50 we can expect the bulls to continue.
- The trading volume has also decreased slightly over the past few days but remains relatively high. As mentioned above, this could turn into a bullish sign for the buyers.
The post BNB Price Analysis: Can Binance Coin Recover Following a Drop To 25% Below It’s All-time High? appeared first on CryptoPotato.


