BNB Broke The All-Time High: Following 40% Weekly Gains, Binance Coin Price Analysis Feb.12
The BNB train continues to steam ahead as price action reaching a daily high at $9.82 during the past 24 hours. The cryptocurrency has now surged by nearly 40% over the past seven days with a further, rather impressive, monthly 60% price.
Over the past hour we see a slight correction, which was anticipated after such a rally. Binance Coin remains ranked in 10th position with a $1.33 billion market cap value as the cryptocurrency now trades around the $9.30 price level. The BNB rally is following couple of positive Binance announcements, including the Binance DEX testnet launch and the return of the Launchpad following the successful BTT fundraising.
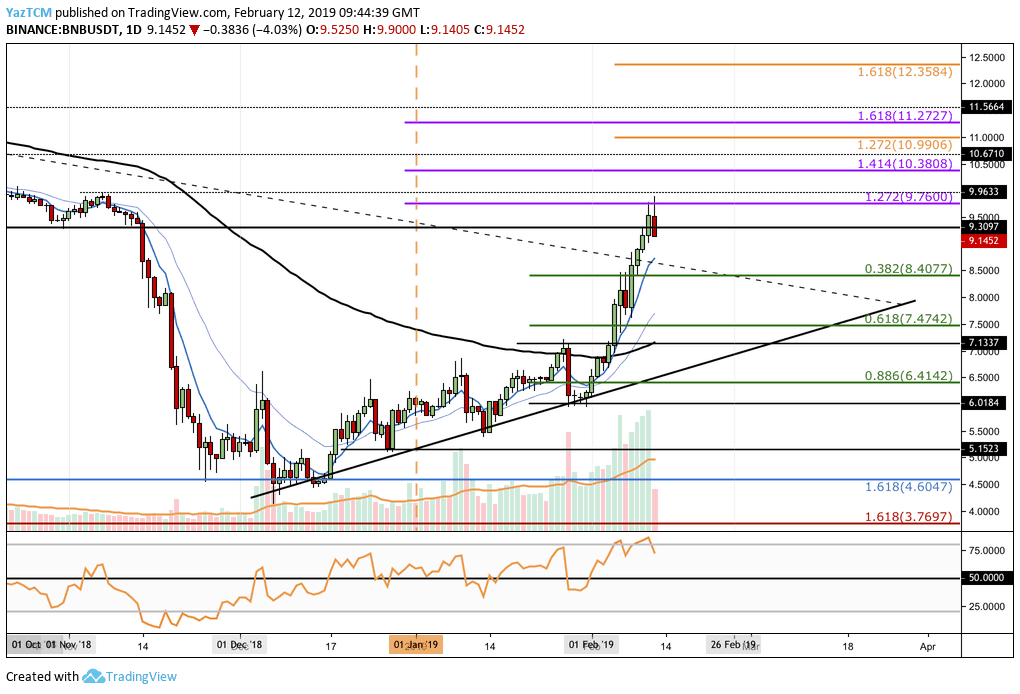
Looking at the BNB/USD 1-Day Chart:
- BNB has broken above the upper boundary of the symmetrical triangle identified on our previous analysis.
- The market has continued to surge and has recently reached resistance at the short term 1.272 Fibonacci Extension level (marked in purple) located around $9.76. We can see that price action has momentarily stalled at this resistance.
- From above: The next resistance is expected around the November 2018 high located at $9.96 – $10.
- If the bulls continue to drive higher and break above $10, we can expect a retest of the short term 1.414 Fibonacci Extension level (marked in purple) located at $10.38. This is followed by the resistance of October high at $10.67.
- From below: the closest support area is the $9.30 level followed by psychological support at $9.00. Below lies the short term Fib level .382 ($8.40) and Fib level .618 ($7.47) (marked in green).
- The RSI remains under overbought conditions and is somewhat stretched. This may indicate that this bull run is ready to slow down for the next coming days.
- The trading volume is increasing having seen over $128 million traded over the past 24 hours (including the BNB-BTC markets as well).
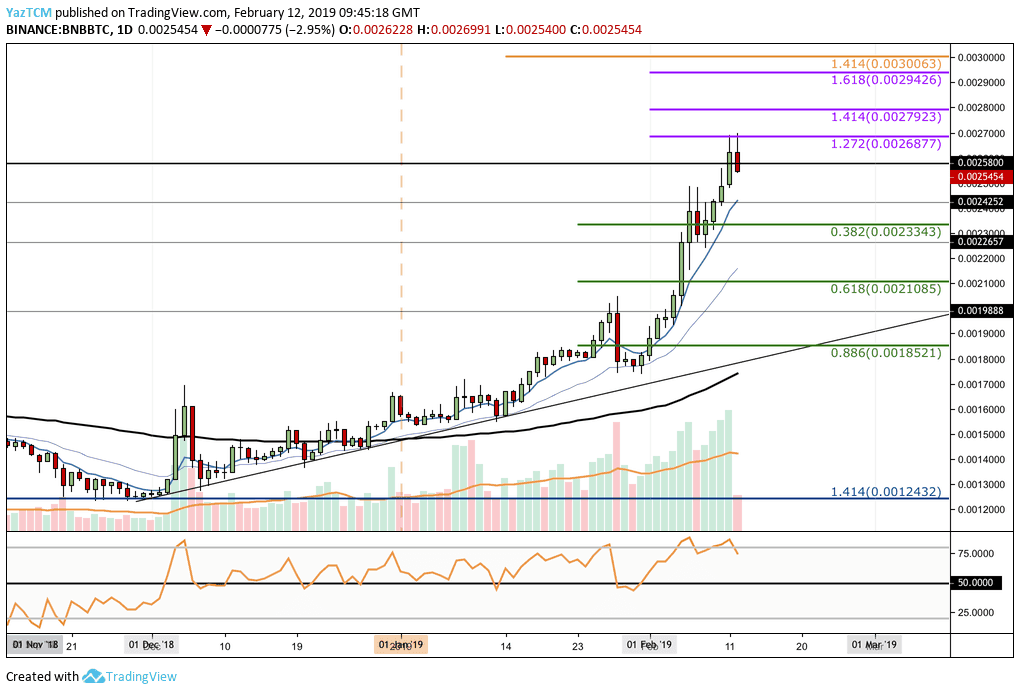
Looking at the BNB/BTC 1-Day Chart:
- Price action for BNB/BTC has broken above recent resistance at 0.0023821 BTC and has continued to surge higher.
- We can see that price action has reached resistance at the short term 1.272 Fibonacci Extension level (marked in purple) located at 0.0026877 BTC and thus has created an all-time high for BNB against BTC.
- From above: resistance is now expected at the short term 1.414 and 1.618 Fibonacci Extension levels (marked in purple) located at 0.0027923 BTC and 0.0029426 BTC, respectively.
- If the buyers continue to push BNB/BTC higher, above 0.0030 BTC, we can expect a test of the next resistance at the medium term 1.618 Fibonacci Extension level (marked in orange) located at 0.0032608 BTC.
- From below: BNB is now testing support level located at the 0.0025800 BTC level. This is the high day close price from June 2018.
- Further below, support lies at the 0.002452 BTC level followed by the short term .382 (0.0023343 BTC) and .618 (0.0021085 BTC) Fibonacci Retracement levels (marked in green).
- Similarly, the RSI is also under overbought conditions and rather stretched which may indicate that the market may need to retrace slightly to give the market room to breath some before continuing higher.
- The volume is extremely high also in the BNB-BTC markets.
The post BNB Broke The All-Time High: Following 40% Weekly Gains, Binance Coin Price Analysis Feb.12 appeared first on CryptoPotato.


