Bitcoin’s Whitepaper Is 11 Years Old Today: What Has Been Developed Since?
Today marks an important anniversary for Bitcoin, as exactly 11 years ago, the pseudonymous creator of the protocol, Satoshi Nakamoto, published its whitepaper. It goes without saying that a lot has happened since then, so let’s have a figurative walk down memory lane and see how the network has improved over the years.
Bitcoin’s Hashrate
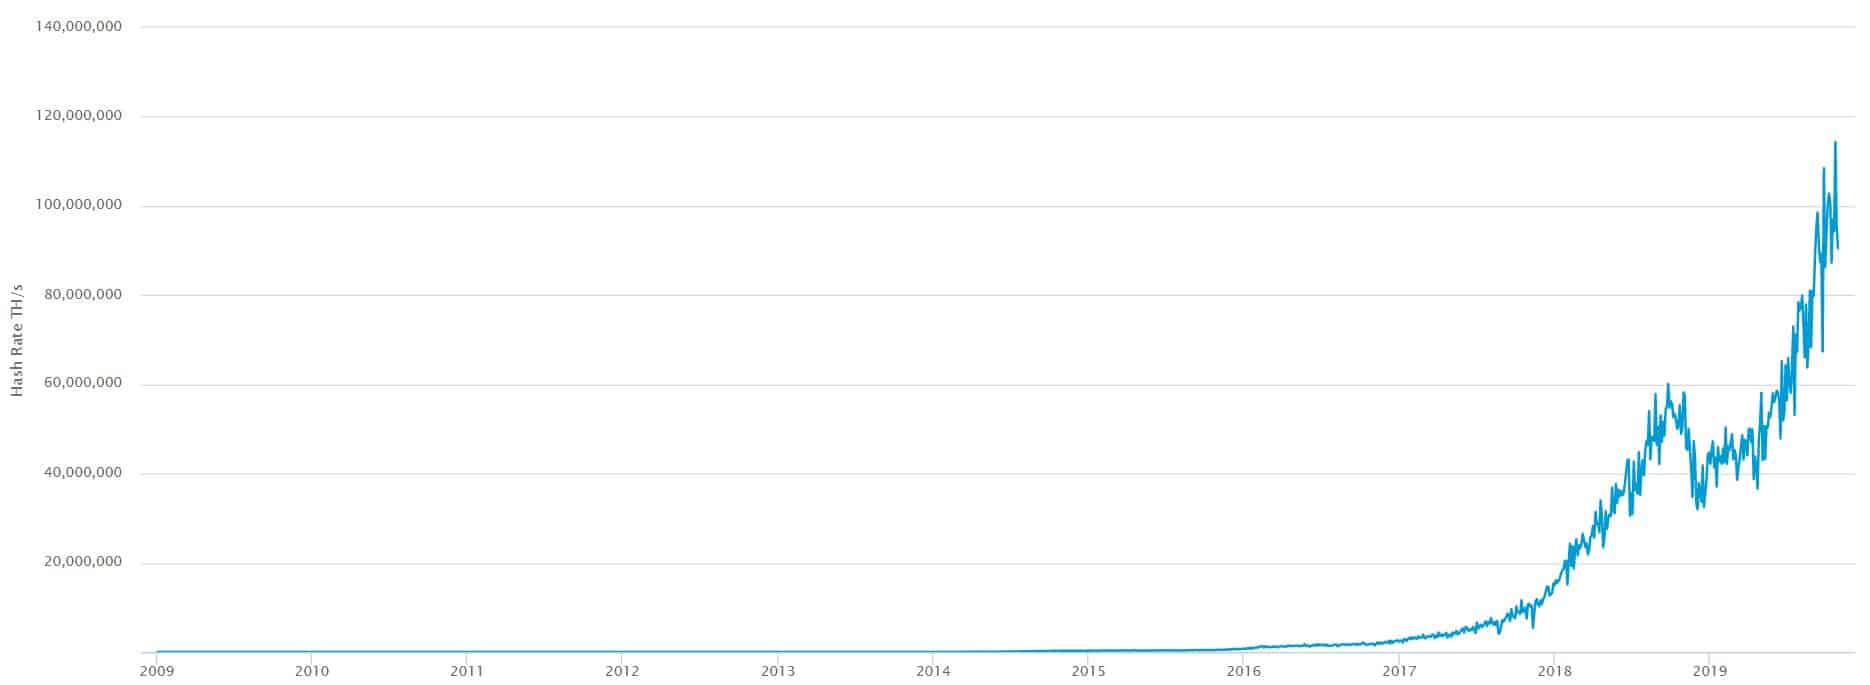
Ever since Bitcoin was first introduced to the world, the network’s hashrate has been increasing steadily. Most of the gains in this respect, however, have come after 2016 and 2017. That’s probably not a surprise, as it was in late December 2017 that Bitcoin hit its current all-time high value of $20,000, and interest in it skyrocketed as well. This is Bitcoin’s hashrate chart:

At the time of this writing, Bitcoin’s hashrate is upwards of 94 million TH/second, an all-time high. The hashrate represents the work that miners are required to do in order to generate the enormous amount of numbers needed to come up with a certain 64-digit hexadecimal number, also referred to as a nonce. It showcases the growth of the network, as well as its increased security.
Unique Addresses and Transaction Value
Another interesting thing to note is that the number of unique Bitcoin addresses is also on its way up. However, this particular statistic is highly correlated to Bticoin’s price, which is perhaps to be expected. As the price goes up, Bitcoin becomes more popular among the mainstream and more people wish to get involved in order to not miss out.

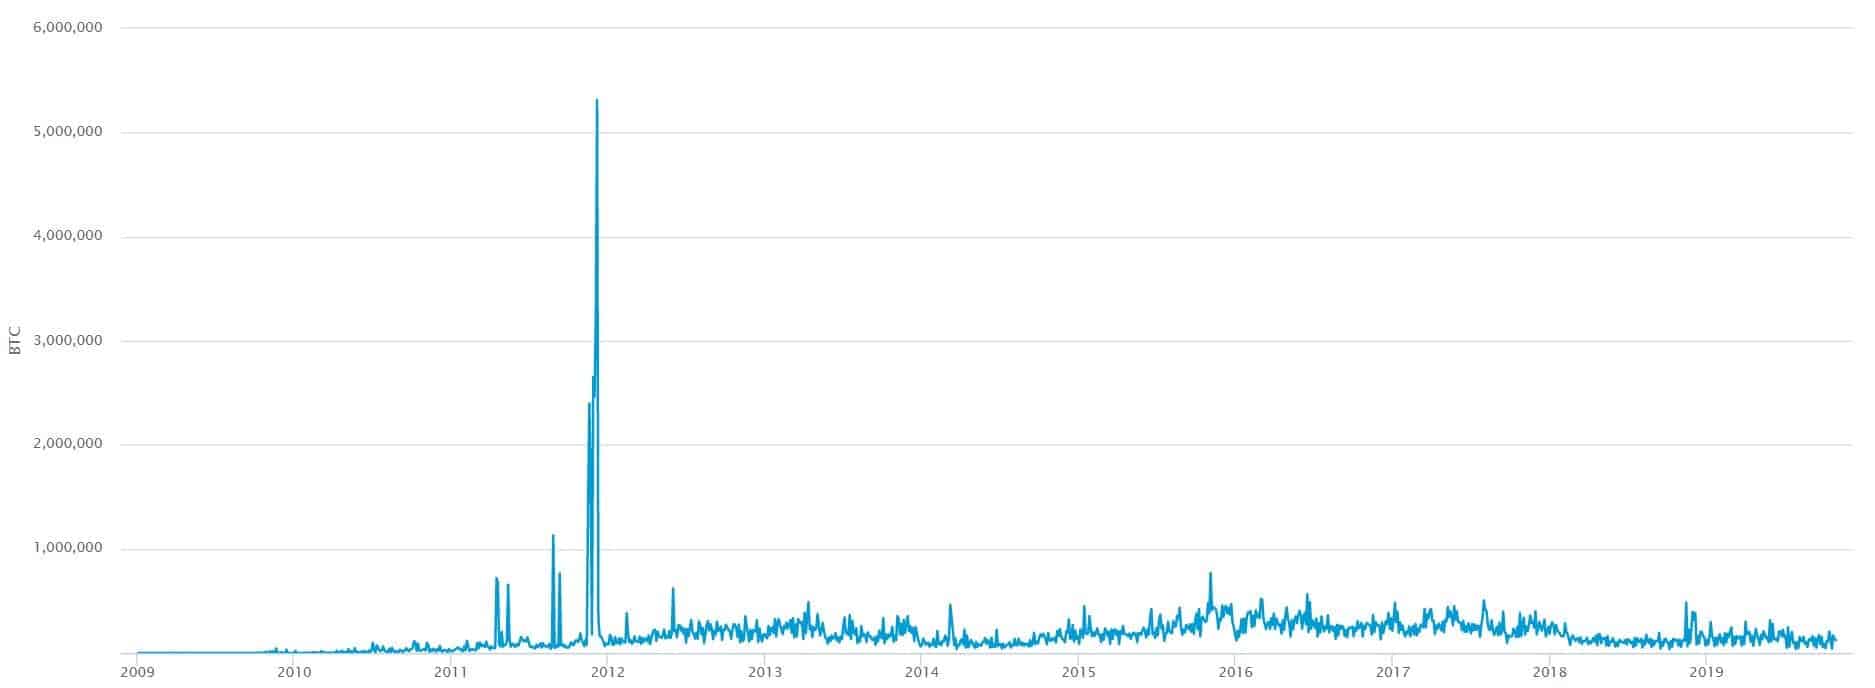
Moreover, the estimated transaction value on Bitcoin’s blockchain has increased over the years.

On October 29th, the estimated value of all transactions carried out on Bitcoin’s blockchain was upwards of 129,000 BTC. For comparison, this number ranged between 0 and 10,000 for the first couple of years after Bitcoin was introduced.
Other Important Fundamentals
Chain metrics are definitely to be considered, but they’re not the only thing that counts. We’ll steer away from Bitcoin’s most obvious development, which is undoubtedly its price, despite the fact that it’s usually the thing that people are most interested in.
Bitcoin has gone a long way over the past 10 years, and people are starting to recognize it for some of its inherent qualities. For once, Bitcoin’s scarcity is a reason why the cryptocurrency is commonly compared to gold and has even been referred to as “digital gold.” A prominent endorsement in this direction came from the chair of the US Federal Reserve, who acknowledged that Bitcoin is a store of value, just like gold.
We have also seen significant developments in terms of trading infrastructure. We now have Bakkt, the Bitcoin futures trading platform designed to deliver institutions with a regulated warehousing and trading experience.
Interesting developments are also coming from the Lightning Network project – a layer-two scalability solution for Bitcoin’s network. Its capacity is already more than 826 BTC, or around $7.4 million at the time of this writing, and it boasts upwards of 35,000 channels.
It’s safe to say that Bitcoin has seen plenty of improvements and developments over the past 10 years. It will be particularly interesting to see whether they continue at this pace and if we ever see Satoshi’s vision come to life and Bitcoin become a mainstream payment method.
The post Bitcoin’s Whitepaper Is 11 Years Old Today: What Has Been Developed Since? appeared first on CryptoPotato.


