Bitcoin’s Uptrend Threatened by Looming ‘Stochastics’ Signal: Fairlead Strategies
-
Bitcoin’s monthly stochastic is teasing an “overbought downturn,” indicating a weakening of bullish momentum, according to Fairlead Strategies.
-
Other indicators like the MACD also suggest the same.
Since November 2022, bitcoin’s (BTC) price has surged nearly 300% from lows around $15,470. This remarkable uptrend is now challenged by a looming “stochastics overbought downturn” signal, according to technical analysis by Fairlead Strategies.
Stochastics is a momentum oscillator technical analysts and traders use to compare a security’s going market rate to a range of prices over a certain period, typically 14 days, weeks, or months. The indicator fluctuates between 0 to 100, with readings above 80 indicating an overbought condition.
An “overbought downturn” has the oscillator moving down from the overbought territory above 80, signaling a weakening of the uptrend and potential for price declines.
Bitcoin’s 14-month stochastic has crossed below 80. The overbought downturn will be confirmed if the situation persists through the end of August.
“The monthly chart of bitcoin shows a pending overbought downturn in the monthly stochastics. If confirmed at month-end, it would be a negative catalyst, suggesting the trading range marked the end to the cyclical uptrend from the 2022 low,” analysts at Fairlead Strategies said in a note shared with CoinDesk Wednesday.
Bitcoin’s uptrend has stalled since March, with bulls repeatedly failing to establish a foothold above $70,000, as represented by the trendline resistance on the monthly chart.
:format(jpg)/cloudfront-us-east-1.images.arcpublishing.com/coindesk/2BQYZOTIRJENHB2A2RJOUFDYKU.png)
The pending overbought downturn on the stochastic indicator is accompanied by shallower bars on the MACD histogram and a flat Ichimoku cloud (the blue shaded area), a sign of a “challenging environment going forward,” according to Fairlead Strategies.
The MACD histogram is widely used to gauge trend strength and changes. Crossovers above and below the zero line represent bullish and bearish trend changes and the height of the bars indicate the strength of the move. The Ichimoku cloud is also a momentum indicator.
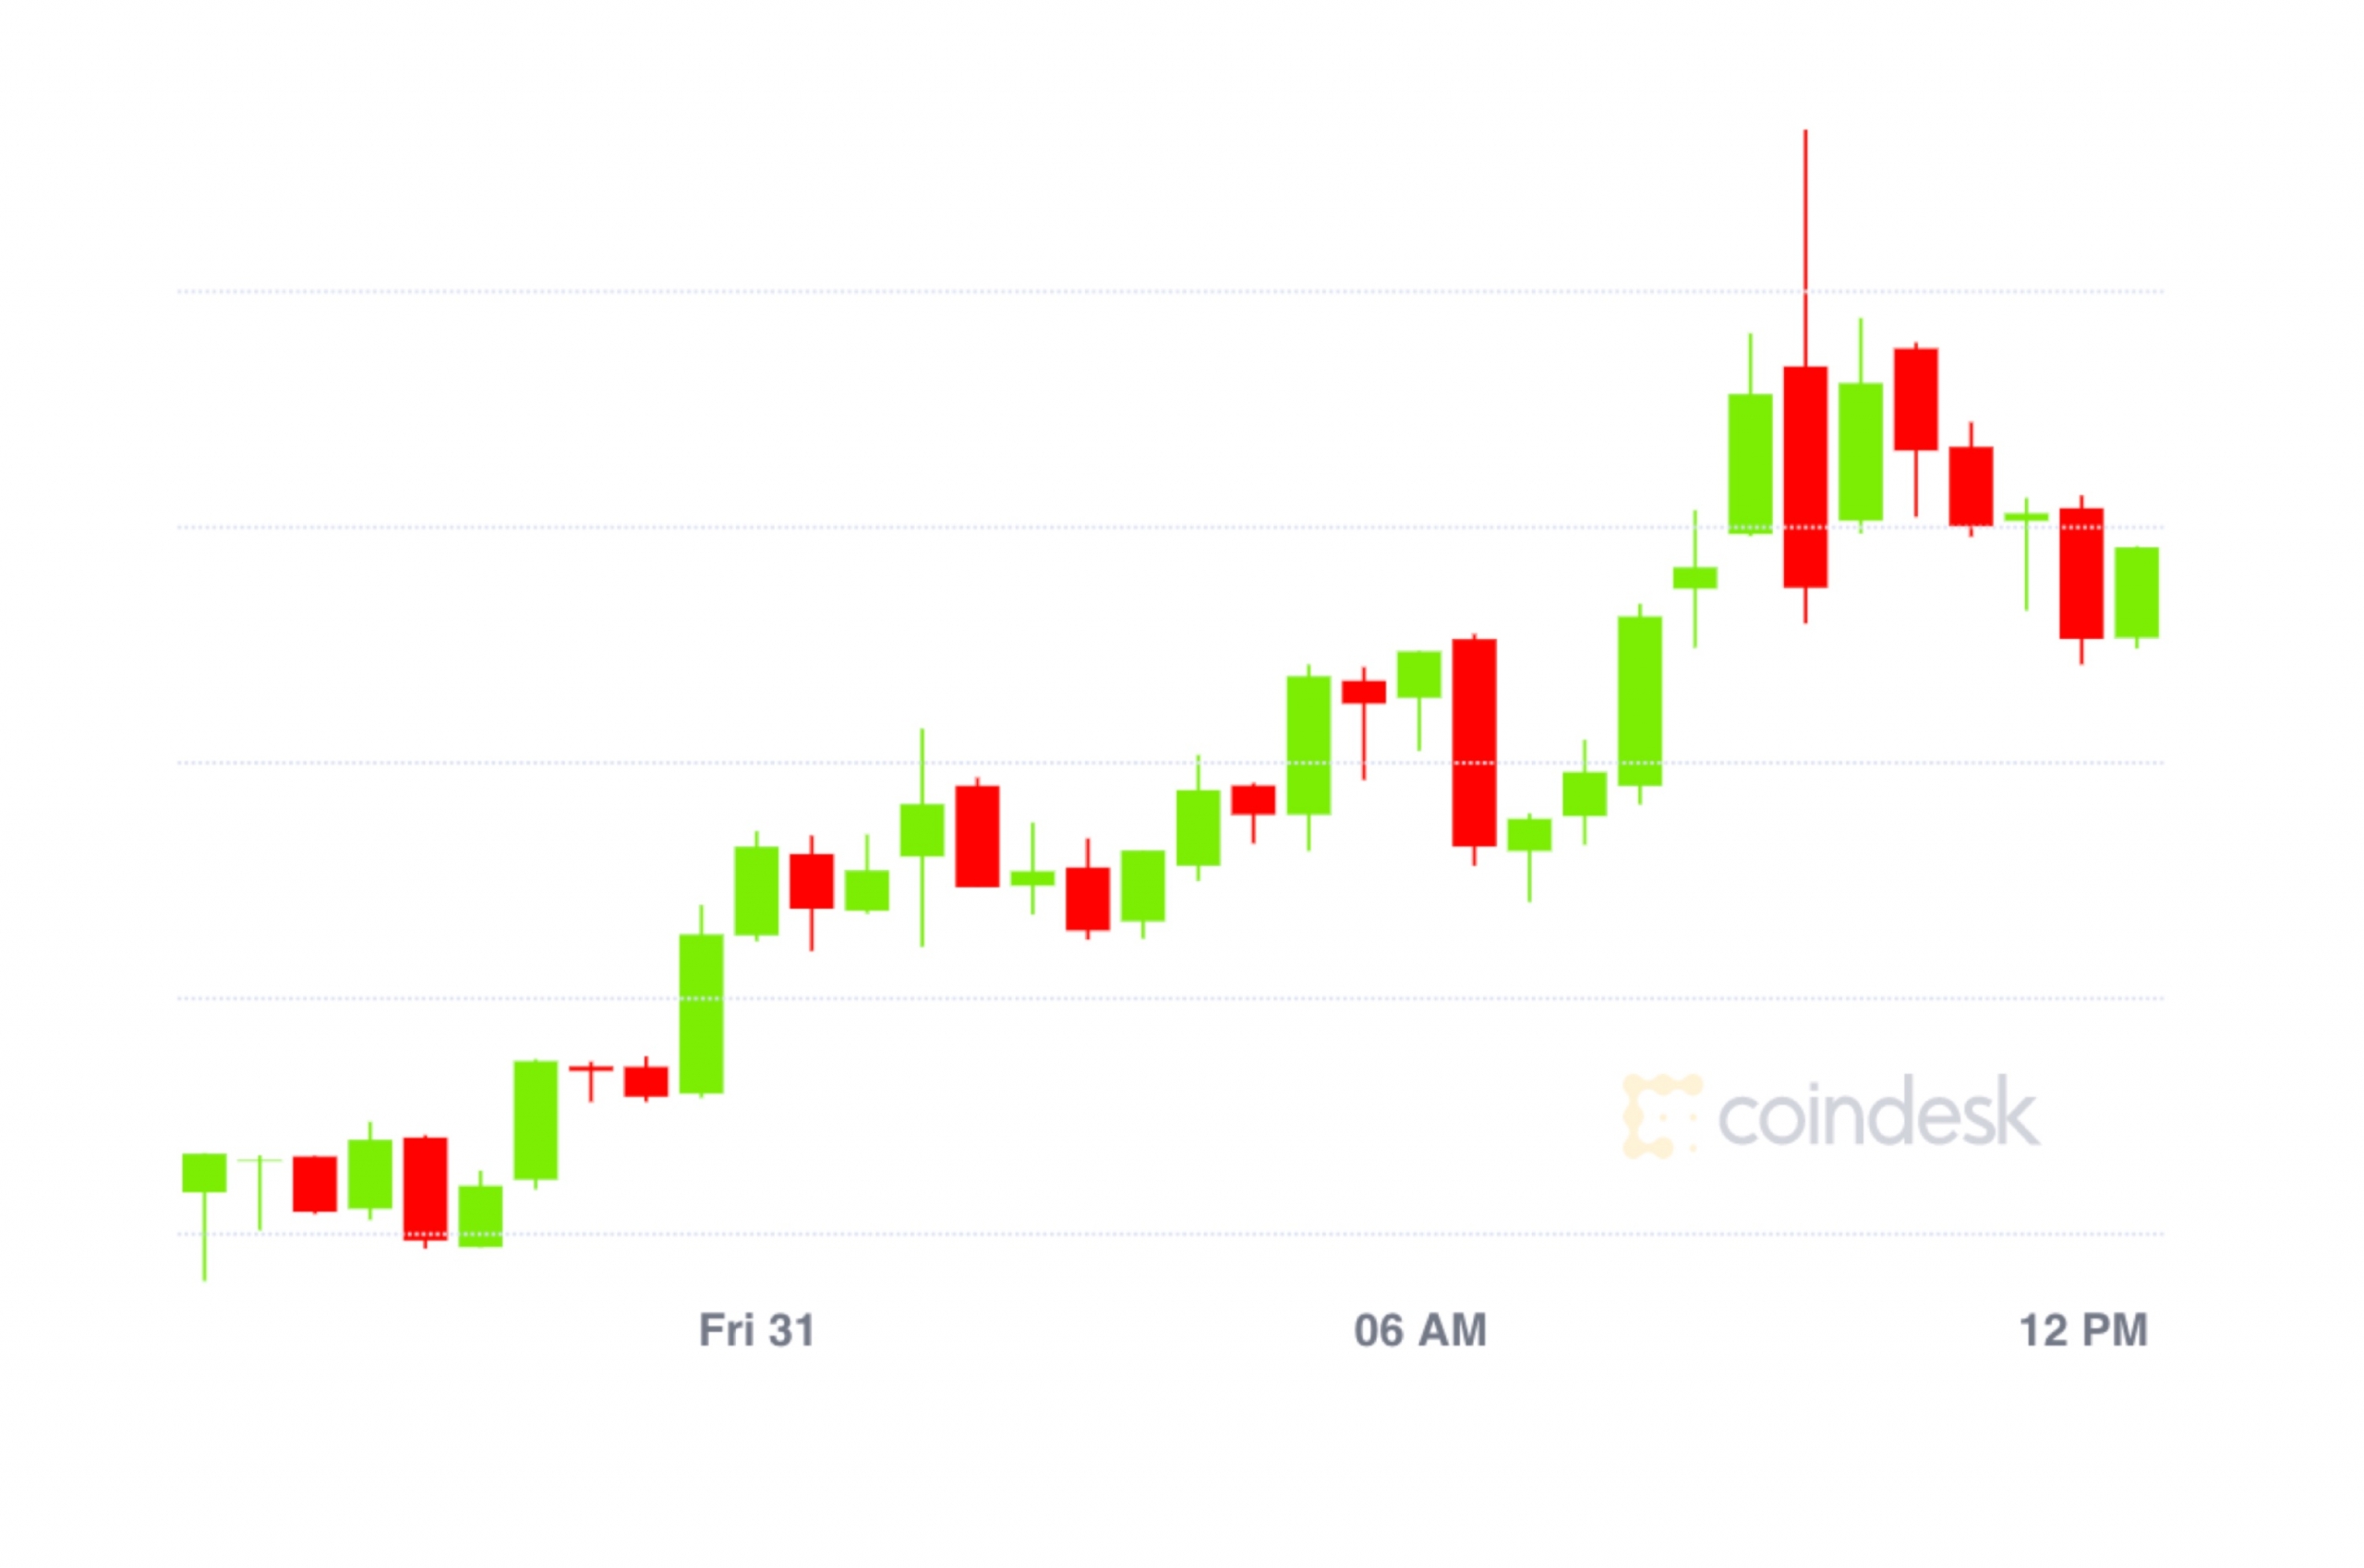
Bitcoin changed hands at $60,660 at press time, according to CoinDesk data.
Edited by Parikshit Mishra.


