Bitcoin’s Unreliable Death Cross Is Looming Again
-
The bitcoin price is staring at the death cross, a pattern that trapped bears on the wrong side of the market last September.
-
BTC’s near-term prospects are closely tied to the health of the U.S. economy and volatility in the Japanese yen.
Some indicators are inherently lagging and offer limited predictive power, yet they consistently make headlines in traditional and crypto markets, often resulting in unnecessary panic among inexperienced investors.
One such example is the bitcoin (BTC) death cross, which tends to spark heightened fear and impulsive reactions on social media despite its poor record of accurately predicting future price trends. So get ready, because one seems to be on the way.
A death cross occurs when the 50-day simple moving average (SMA) of an asset’s market price falls below the 200-day SMA. Right now, the bitcoin price’s 50-day SMA is at $62,332 and falling, indicating a potential crossover with the 200-day SMA at $61,605.
The impending crossover indicates that short-term momentum, represented by the 50-day SMA, is underperforming the long-term average.
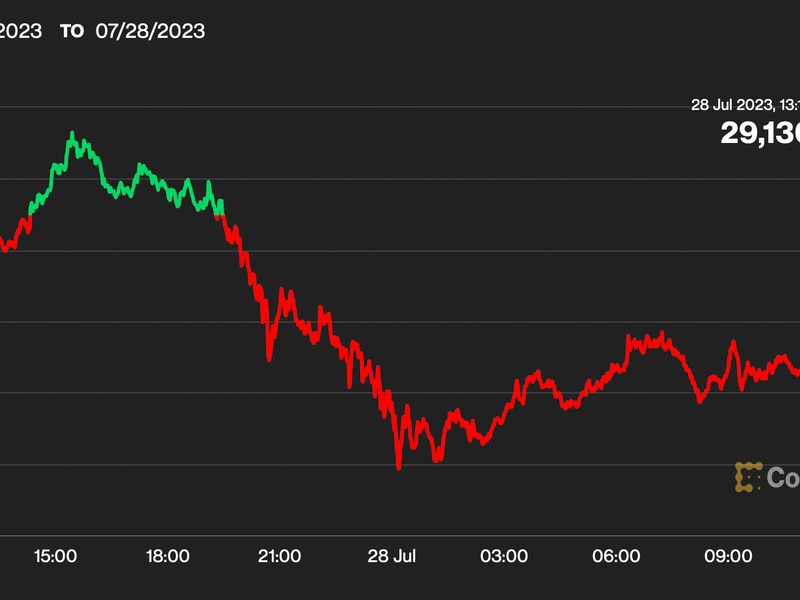
This development is widely interpreted as a bearish signal and leads to catastrophizing – a cognitive distortion that prompts inexperienced traders to jump to the worst possible conclusion, often with limited information and understanding. Overreaction is typical, especially when sentiment is already sour, as in the BTC market. The cryptocurrency has dropped over 20% to $55,000 in one week, according to CoinDesk data.
In reality, the chart pattern only shows the nature of the price action over the recent 50 days. It doesn’t guarantee future moves will follow in the same direction.
The previous death cross confirmed on Sept. 12, 2023, was a major bear trap. BTC bottomed out at $24,900 on the same day and never looked back, eventually reaching new record highs above $70,000 in March this year. Investors who’d positioned for further declines were caught out.
The previous nine death crosses have a mixed record, with only five presaging prolonged downtrends, as CoinDesk discussed last year.
To sum up, the death cross is unreliable as a standalone indicator. Bitcoin’s near-term prospects largely depend on the U.S. economic data and the volatility in the Japanese yen. Continued demand for the yen in the foreign exchange markets may further dent carry trades and keep risk assets, including BTC, under pressure.
:format(jpg)/cloudfront-us-east-1.images.arcpublishing.com/coindesk/Q2YGPH5Y45GO5D6YSIW4FLFA6Q.png)
Edited by Sheldon Reback.
Disclosure
Please note that our
privacy policy,
terms of use,
cookies,
and
do not sell my personal information
has been updated
.
CoinDesk is an
award-winning
media outlet that covers the cryptocurrency industry. Its journalists abide by a
strict set of editorial policies.
In November 2023
, CoinDesk was acquired
by the Bullish group, owner of
Bullish,
a regulated, digital assets exchange. The Bullish group is majority-owned by
Block.one; both companies have
interests
in a variety of blockchain and digital asset businesses and significant holdings of digital assets, including bitcoin.
CoinDesk operates as an independent subsidiary with an editorial committee to protect journalistic independence. CoinDesk employees, including journalists, may receive options in the Bullish group as part of their compensation.
:format(jpg)/s3.amazonaws.com/arc-authors/coindesk/31d39a34-26a1-4e78-a5da-d5cf54a9d695.png)


