Bitcoin’s Price Could Top at $300,000 if History Repeats: Analysis
Although the price of bitcoin fell by over $10,000 since its all-time high of $42,000, historical on-chain data suggests that the asset could still experience a significant increase in the following months.
Simultaneously, another indicator implied that BTC’s correction has gone through its most harmful stage and could end soon.
BTC’s Correction To Finish Soon?
Following a substantial price increase that led to a new all-time high in early January, the primary cryptocurrency hit a wall and currently struggles with the $30,000 psychological line.
This more than $10,000 price decline raised discussions if this bull cycle has ended and BTC is heading for a prolonged correction, similarly to the bear market in 2018 after the previous ATH.
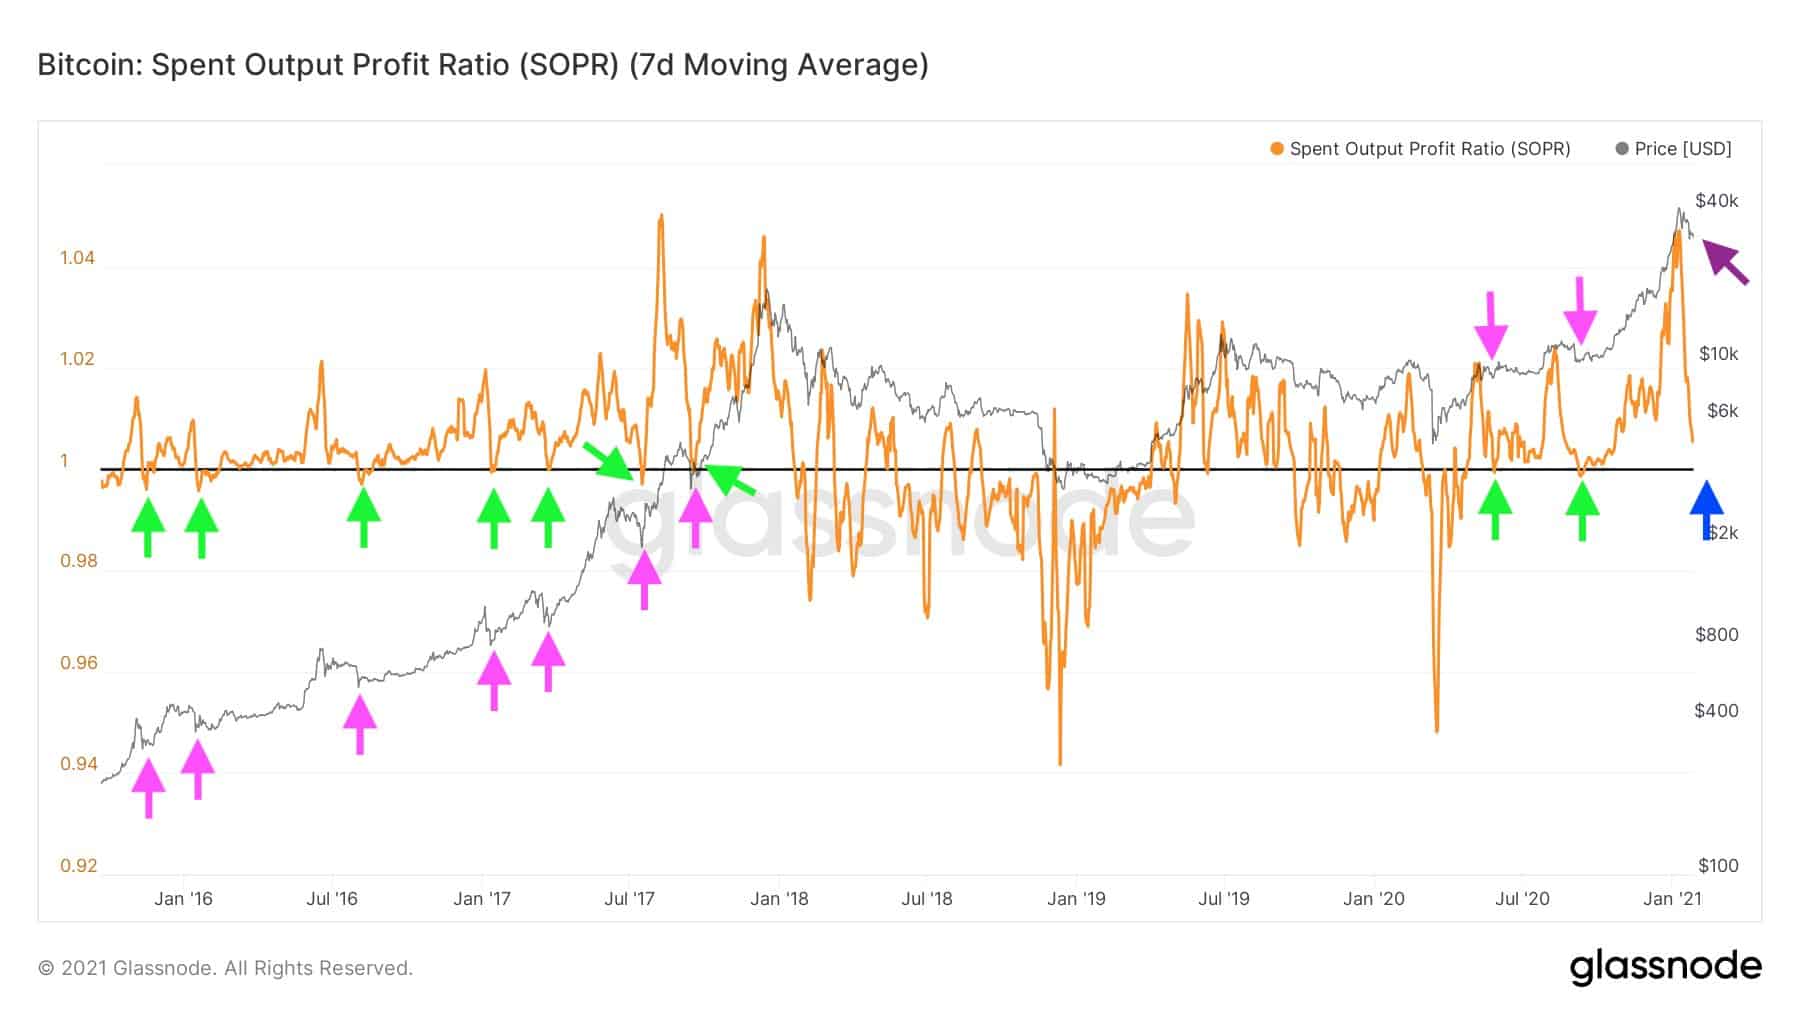
However, Glassnode data suggests the opposite. The Spent Output Profit Ratio, dividing the realized value (in USD) by the value at creation of a spent output, is typically used to outline the state of a BTC correction during a bull run.
Following the recent steep decline, the metric has dropped to near neutral levels, which hints that the retracement is almost finished.
BTC’s Bull Run To Resume With A 900% Surge?
Should the retracement indeed end, further Glassnode data sees impressive gains hidden behind the corner for Bitcoin, according to the Net Unrealized Profit/Loss (NUPL) metric.
By exploring the price when a UTXO (unspent transaction output) was created versus the current price of an asset, NUPL determines if the coins within that UTXO are in a state of an unrealized profit or loss.
In other words, the metric looks at the difference between unrealized profit and unrealized loss to conclude whether the network as a whole is currently in a state of profit or loss.
Glassnode measures it with -2 being the most significant level of a loss, to +1 representing a “euphoria” zone where almost all positions are in a state of an unrealized profit. The analytics company has asserted that if the metric goes above 0.75, it enters the so-called euphoria, typically followed by a sharp retracement.
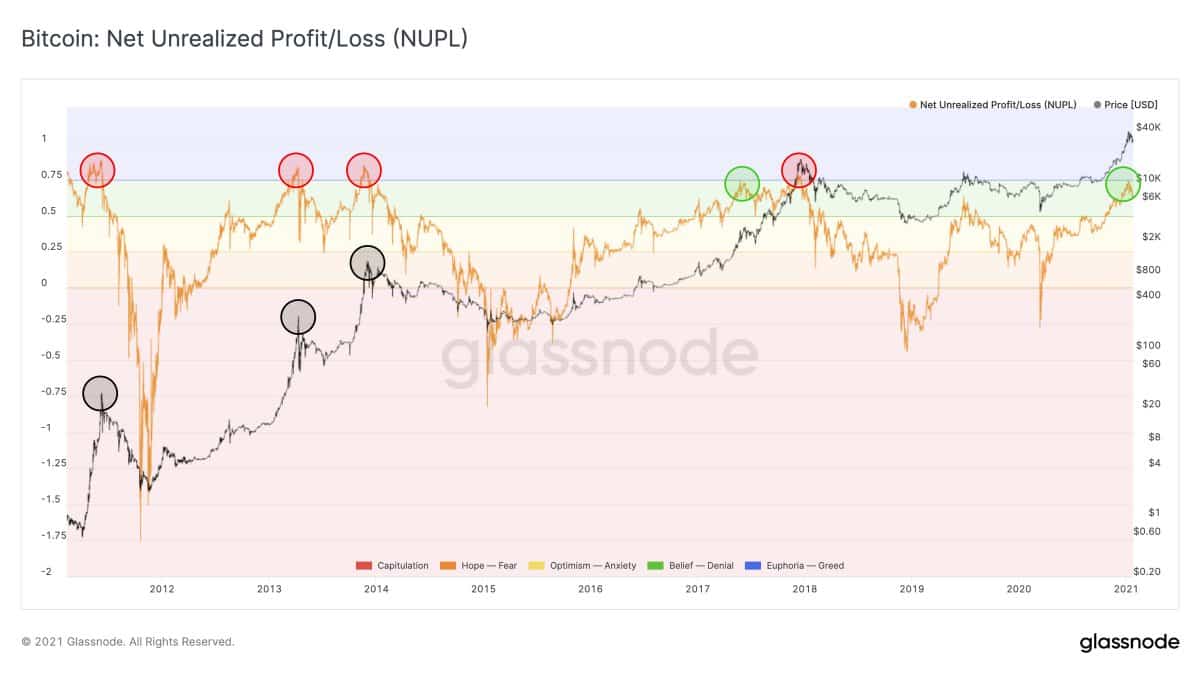
As the graph demonstrates, BTC has dumped almost immediately after NUPL had gone above 0.75. However, bitcoin was rejected this time, and history shows a possible impending price surge.
The last time BTC’s NUPL was rebuffed at this level, during the bull cycle in 2017, the cryptocurrency “increased around 900% before hitting the top,” said Glassnode. If the asset is to skyrocket by such a percentage now, it would drive the price to $300,000.

