Bitcoin’s Consolidation at $29K Continues, is a Recovery Inbound? (BTC Price Analysis)
A descending channel has accompanied Bitcoin’s price since setting a new all-time high of $69K, clearly indicating a bearish phase. The following is aimed at investigating and evaluating possible scenarios in the mid-and short term.
Technical Analysis
By Shayan
The Daily Chart
The price is now consolidating above the middle trendline of the channel. The $28.6K – $28.8K critical demand zone and the channel’s mid-line have been acting as reliable supports for Bitcoin.
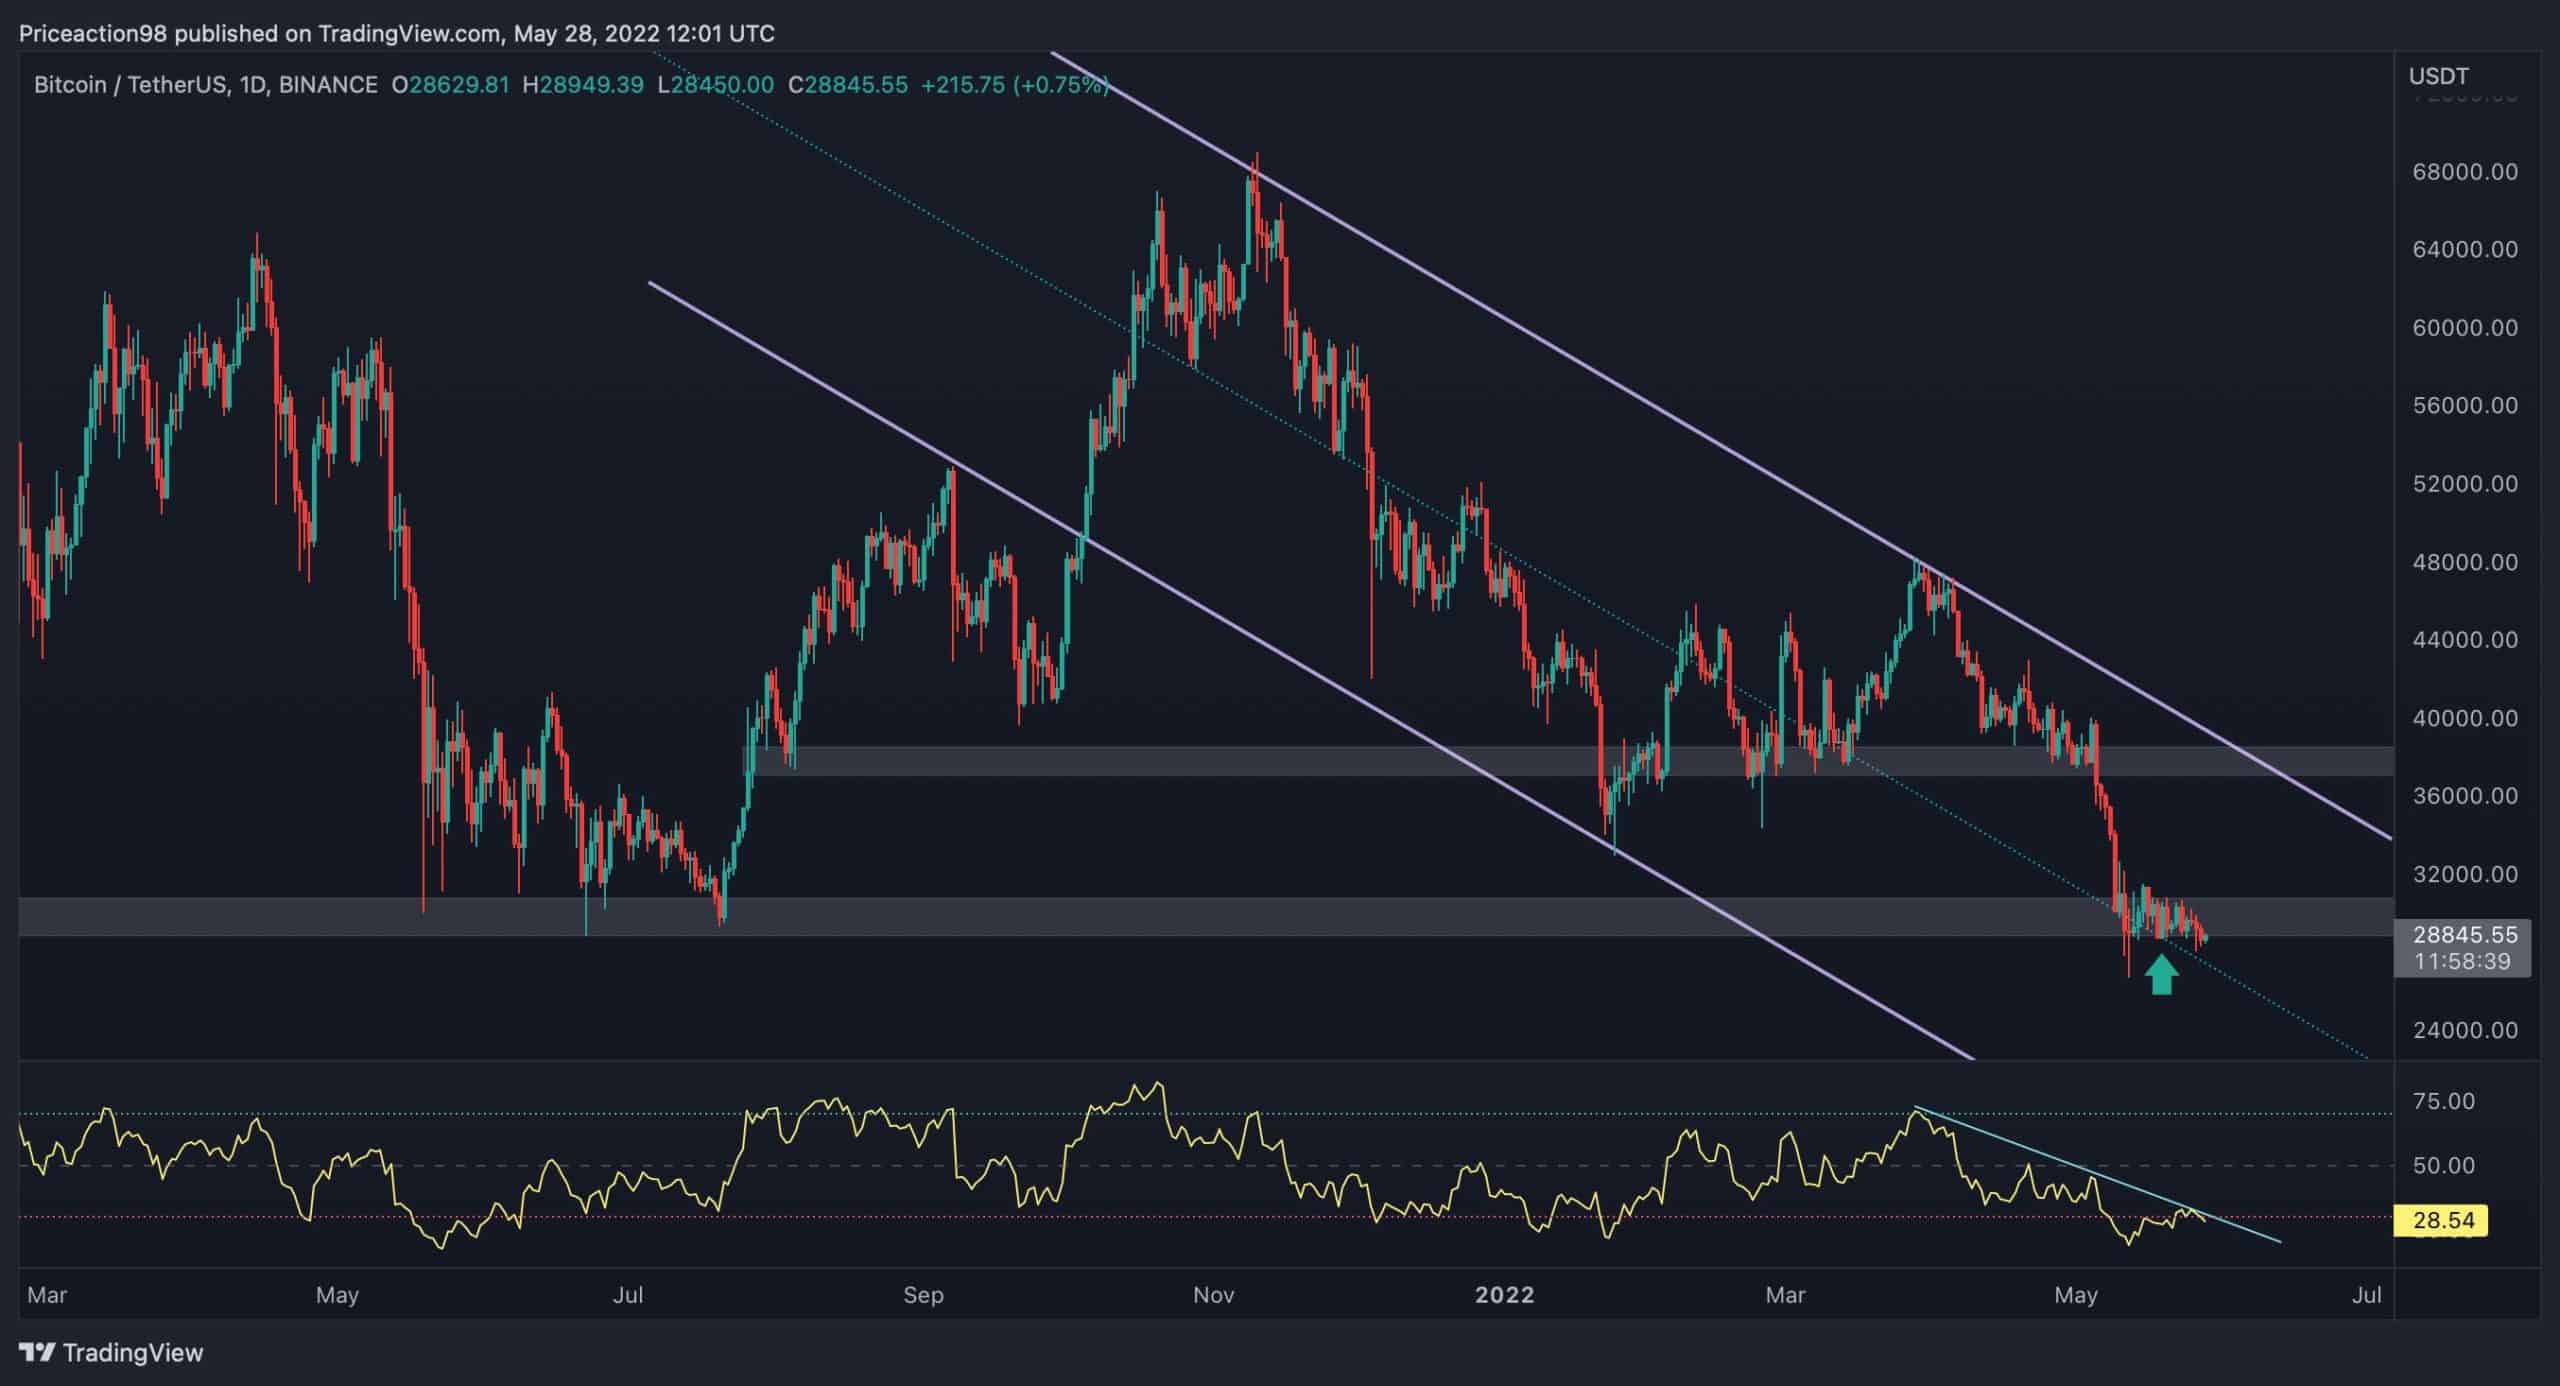
On the other hand, Bitcoin’s RSI has failed to break above its declining trendline twice and is currently seeking to do so for the third time. A second surge toward the $37K resistance level will be inevitable if the breakthrough occurs.
The 4-Hour Chart
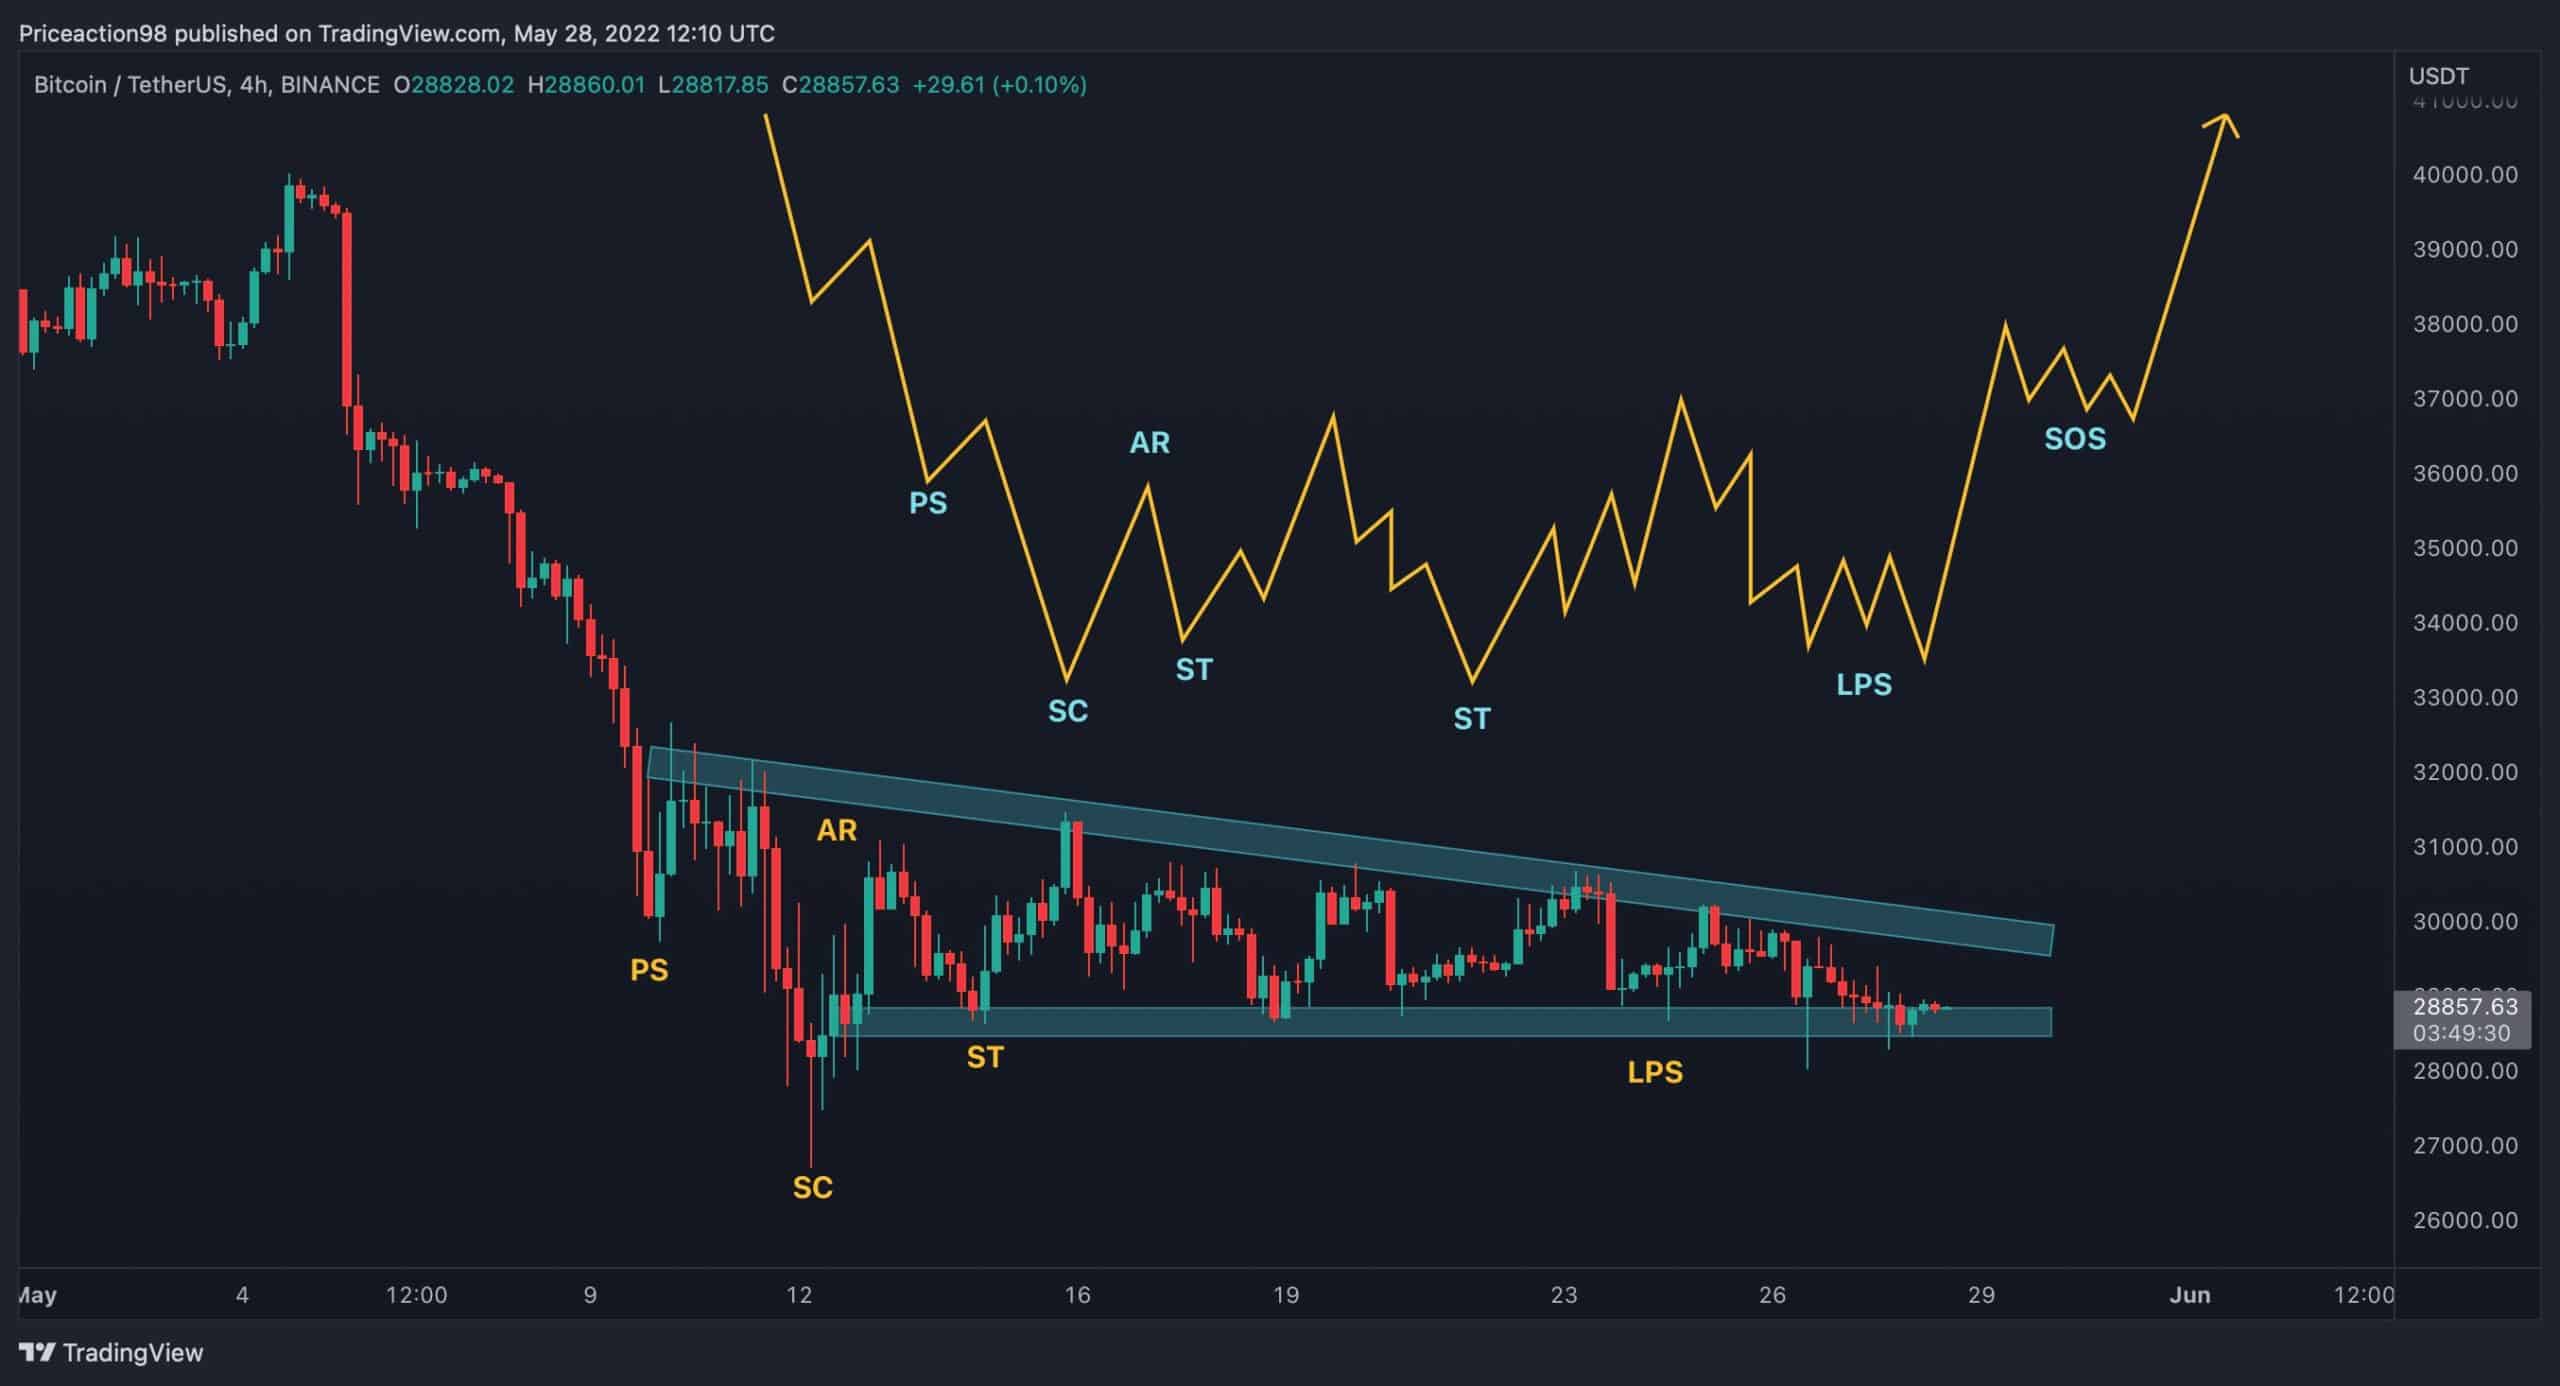
The price fluctuates within a falling wedge pattern, which is often referred to as a reversal pattern if the upper trendline is broken. On the other hand, a clear Wyckoff accumulation phase is evident on the lower time frames. The price has registered the PS (preliminary supply), SC (sellers climax), AR (automatic rally), ST(secondary test), and is currently in the LPS (last point of support) stage.
Based on the fact that the price is consolidating inside a significant demand zone and forming a Wyckoff accumulation pattern, a reversal followed by a mid-term climb seems like a more probable scenario for Bitcoin in the coming days.
Sentiment Analysis
By Edris
Bitcoin Funding Rates
Bitcoin has been in a ruthless downtrend for the past few months, falling from the $69K all-time high in November 2021 and even breaking below the $30K mark, which was considered significant support by many market participants.
But this level failed to hold as the price has broken below it and has been trading there over the last few weeks. Typically, price bottoms are associated with the extreme bearish sentiment, as demonstrated by negative funding rate values.
However, during the recent crash, the funding rates have been oscillating around zero and are even back to positive in recent days. These values could indicate that the price is far from putting in a solid bottom. This consolidation period could be a correction before another bearish leg, as the market is still far from the extreme fear and negative sentiment at the bear market bottoms.
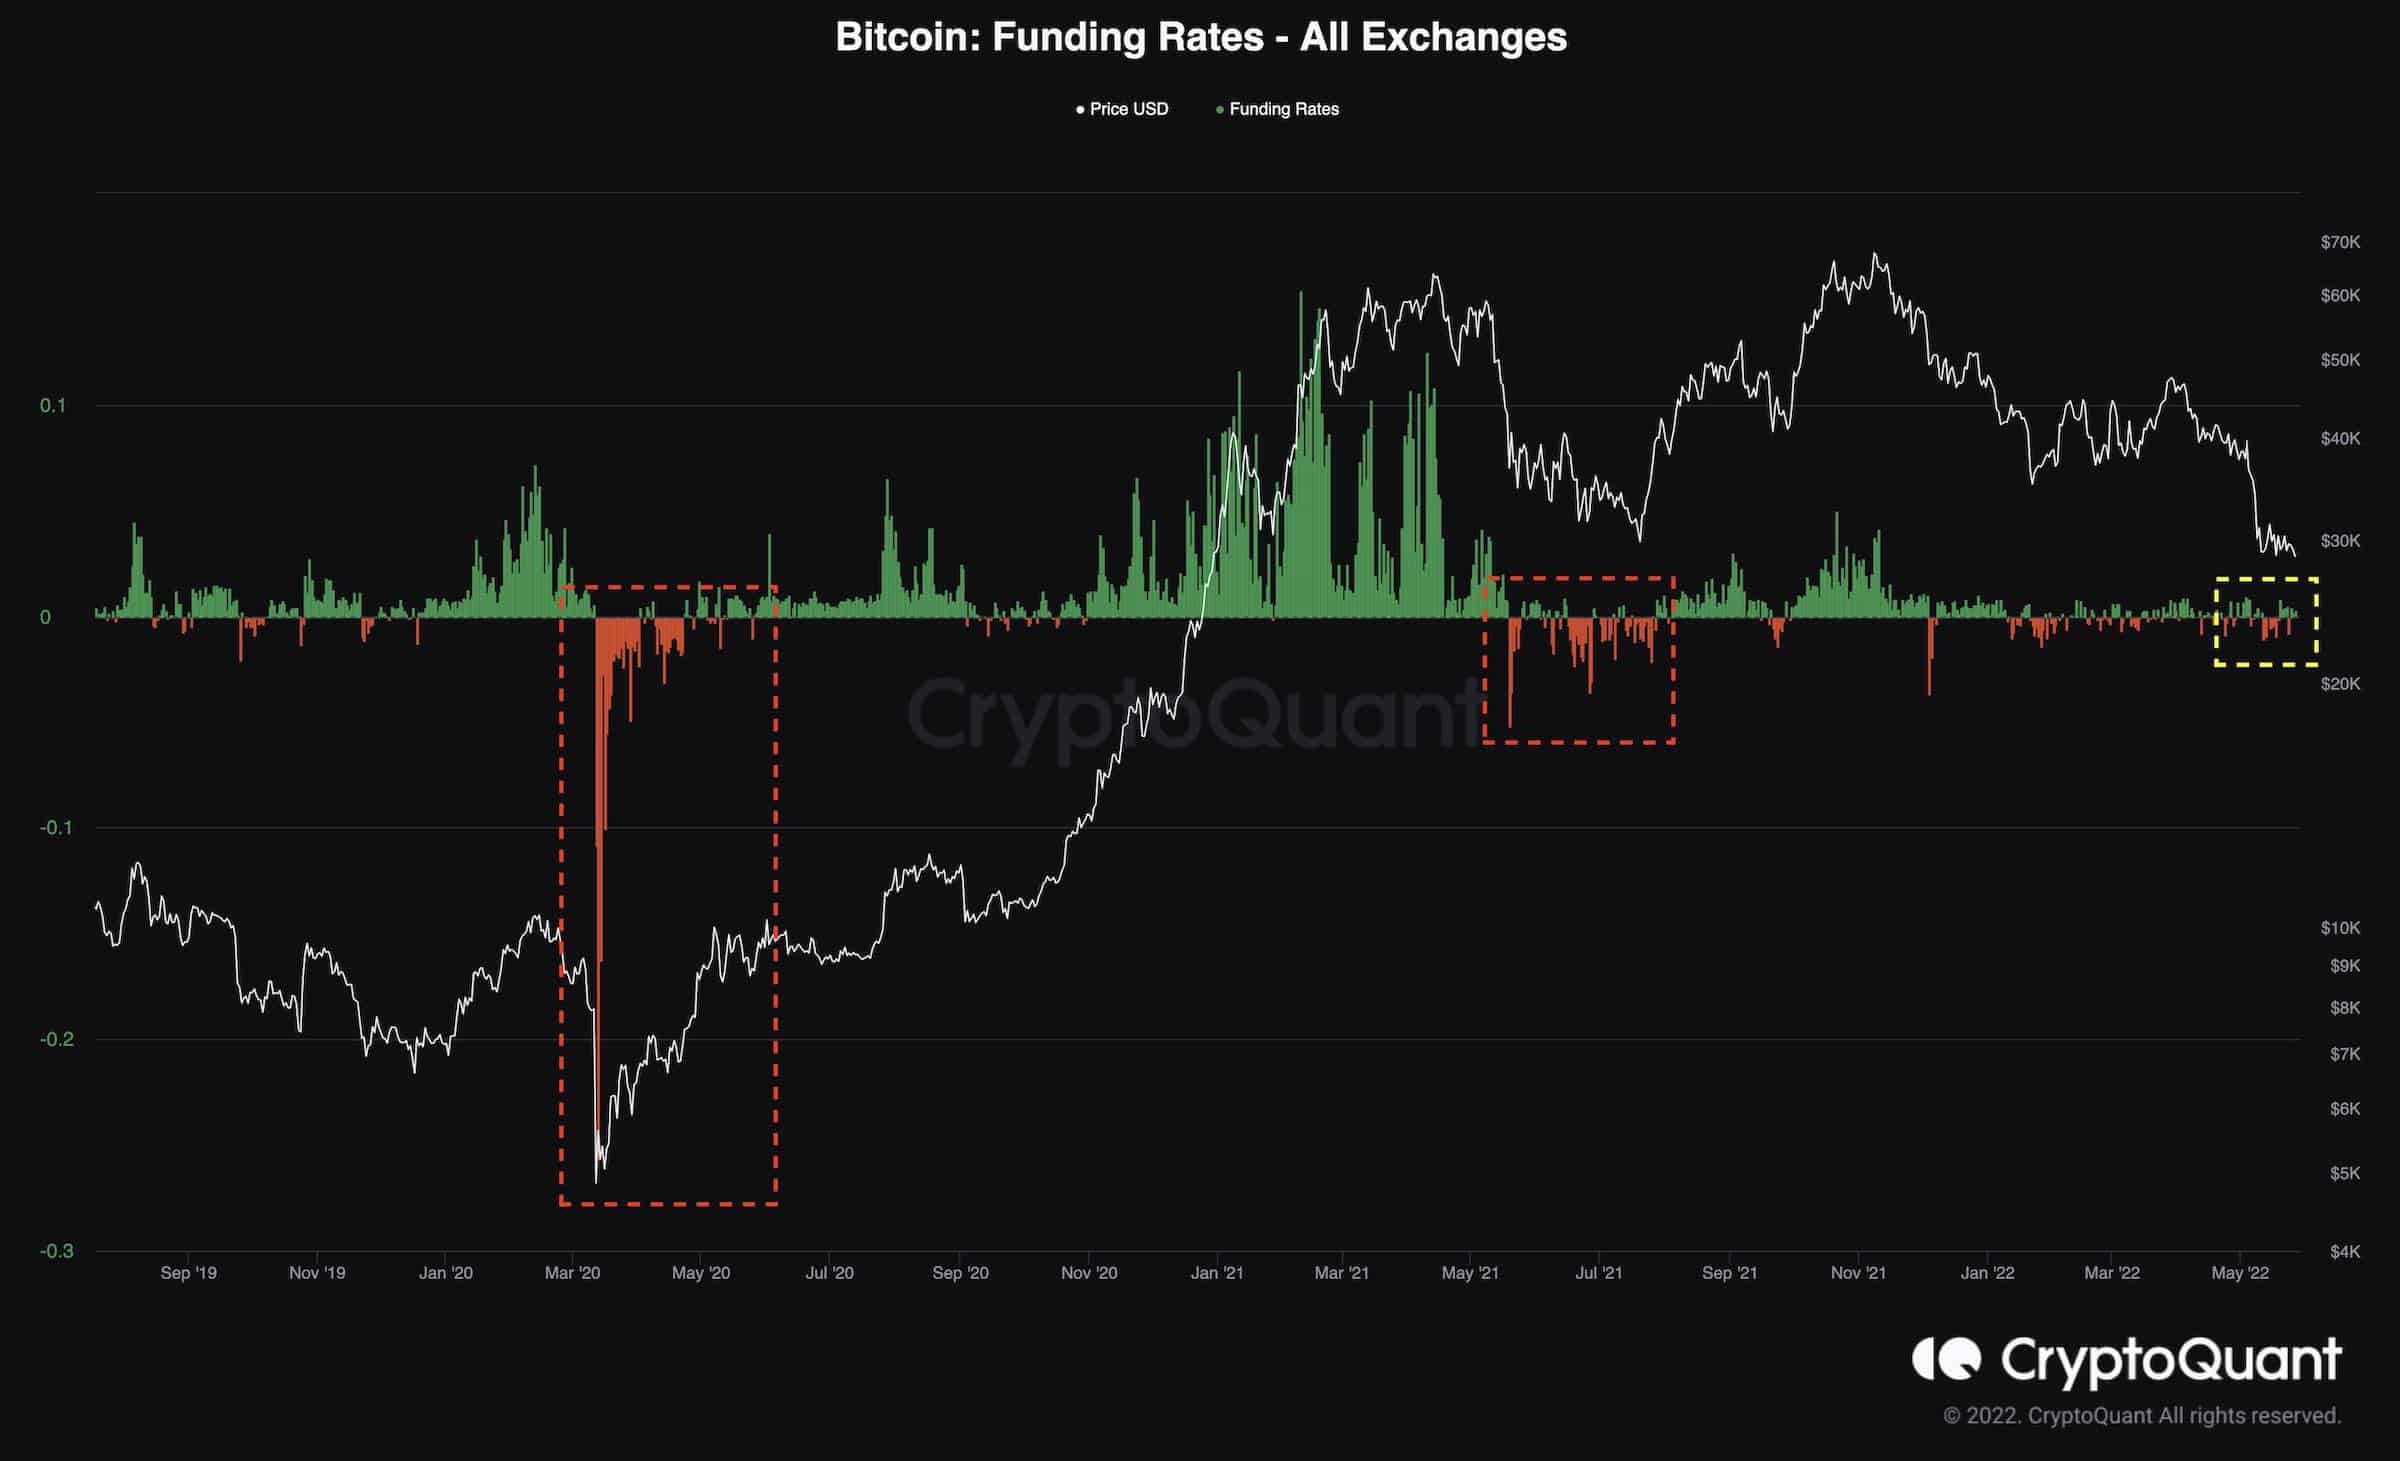
Significantly negative values of funding rates could lead to a massive short-squeeze, similar to March 2020 and July 2021 bottoms, and initiate a new bullish trend for the mid-term.


