Bitcoin Volatility Is Up, Liquidity Stagnant
“Beached Whale,” 1598, image via Metropolitan Museum of Art
Galen Moore is a Senior Research Analyst at CoinDesk. The following article originally appeared in Institutional Crypto by CoinDesk, a weekly newsletter focused on institutional investment in crypto assets. Sign up for free here.
Bitcoin’s price volatility has been a source of doubt about its narrative both as digital cash and as digital gold.
How could something so volatile be a safe haven investment? How could it be a reliable unit of account or a medium of exchange? Attention to the volatility problem is apparent in the many attempts to mint “stablecoins,” digital currencies pegged to fiat money.
Perhaps bitcoin itself will achieve stability over time, as its liquidity improves with growing investment in the crypto-asset category. Those who believe it will do so may feel disappointment or impatience reading this article.
For in 2019, market and network data have told a different story: volatility has increased and liquidity remains stagnant.
Bid-ask spreads aren’t narrowing
One reliable measure of liquidity is the bid-ask spread: the difference between the price a seller wishes to realize and the price a buyer wishes to pay. Narrow bid-ask spreads are a sign of a liquid market, in which relatively large amounts can trade without moving the price.
We looked at six BTC/USD exchanges for which bid-ask spread data were available. The data show that bitcoin/dollar markets’ bid-ask spreads are wide, compared to other asset categories – and that 2019 has brought little to no relief.
Half of the six exchanges ended November with a wider average monthly bid-ask spread than a year ago; the other half were narrower. The average change was a 0.14 percent widening. The two exchanges with the narrowest bid-ask spreads over the period, Bitfinex and Coinbase, both saw bid-ask spreads widen.
Average monthly spreads, expressed as a percentage of the price, range from 0.045 percent on Coinbase in March, to 0.304 percent on itBit in July. For comparison, bid-ask spreads on Vanguard ETF products right now range from 0.01 percent to 0.09 percent.

Greater volatility isn’t attracting liquidity providers
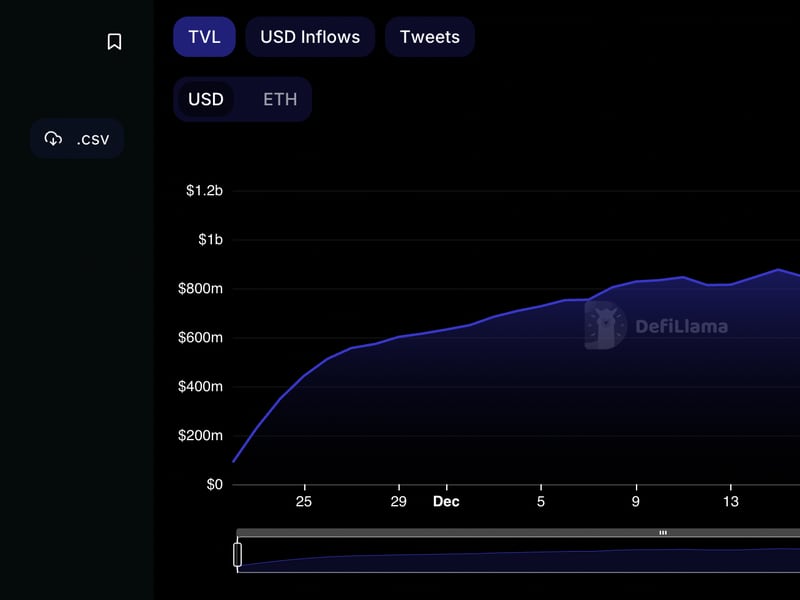
As the chart above shows, BTC/USD bid-ask spreads tend to widen in periods of high volatility. That’s normal, as market makers seek to profit from investors’ fear and greed. Compared with the second half of 2018, this year has been bumpy for bitcoin: the 30-day volatility of daily returns has topped 4 percent on 65 days in the past 12 months. It’s fallen below 1 percent on just six days in the same period. The data is from data.bitcoinity.org.
Liquidity providers are not rushing in. To measure market makers’ enthusiasm for bitcoin, we turn to network data: the aggregate balances of exchange wallets, as a percentage of bitcoin’s total supply. This measure of exchanges’ bitcoin flows shows some responsiveness to volatility. Year-to-date highs were set in late May and early July, when volatility was on the rise and peaking, respectively.
However, those points stand out in a flat sea: exchanges’ bitcoin wallet balances haven’t changed much since declining in 2018, holding around 8 percent, a point first reached in mid-November, 2017.

Labeling wallets is an inexact science. Exchanges’ activities on the bitcoin network tend to follow predictable patterns, indicating net inflows. However, large balances often move in unpredictable ways and it can be difficult to distinguish the flow of capital from a change in custodial practice. This wallet labeling data is provided by IntoTheBlock.
As the end of 2019 approaches, bitcoin appears to be in stasis. Markets are no more liquid than they were, this time in 2018 – still an order of magnitude less than bitcoin’s blue-chip equivalents on the US stock market.
The path out of this stasis is murky. Bitcoin’s volatility has increased, while the percentage of bitcoin engaged in the market has remained flat. If stability and liquidity are part of bitcoin’s road to becoming a more mature asset, the year 2019 has been a period of arrested development.
Special thanks to Kaiko for help validating bid-ask data.
Disclaimer Read More
The leader in blockchain news, CoinDesk is a media outlet that strives for the highest journalistic standards and abides by a strict set of editorial policies. CoinDesk is an independent operating subsidiary of Digital Currency Group, which invests in cryptocurrencies and blockchain startups.
This article is intended as a news item to inform our readers of various events and developments that affect, or that might in the future affect, the value of the cryptocurrency described above. The information contained herein is not intended to provide, and it does not provide, sufficient information to form the basis for an investment decision, and you should not rely on this information for that purpose. The information presented herein is accurate only as of its date, and it was not prepared by a research analyst or other investment professional. You should seek additional information regarding the merits and risks of investing in any cryptocurrency before deciding to purchase or sell any such instruments.