Bitcoin Touched $7000 – Two Things to Be Worried About: Price Analysis & Overview May 11
During the bull-market of 2017, it was common to see Bitcoin increasing thousand USD daily. During the peak of the 2018 bear market Bitcoin had lost over 40% in just two weeks.
Just yesterday, following the break-out of $6000, we mentioned the next major resistance area for BTC at $6300 – $6400. It took the coin only a couple of hours, but the party continued, and this morning Bitcoin had touched $7000.
Two Unsolved Red Flags to Look On
Are the bulls back? Will we see Bitcoin at $10K shortly? Maybe, but in my opinion, it’s too early to say so.
Two scandals are hovering around the crypto markets these days that can easily manipulate the BTC price:
Binance: Following the hack, Binance had closed its gates for deposits and withdrawals during their $40 million hack investigation. Binance is, by far, the largest crypto exchange. If funds can’t go in and out, manipulations can be done quickly by large whales or investors holding large amounts on Binance and other exchanges. It will be interesting to see what exactly will happen once Binance opens its withdrawals again. Keep in mind, Binance announced on a 7 days investigation period. In any case this investigation will last longer the market might respond violately.
BitFinex: Following the recent $850 million scandal and throughout the past two weeks since then, BitFinex had a remarkable 6% price difference for Bitcoin. This was unhealthy and likely happened since the exchange users had bought Bitcoin to cash out. However, as reported yesterday, the price difference had shrunk to only around 1%. From one side this shows strength; however, as in crypto everything is almost always very fragile and can change anytime.
Total Market Cap: $206 Billion
Bitcoin Market Cap: $120 Billion
BTC Dominance: 58.0%
Looking at the 1-day & 4-hour charts
– Support/Resistance:
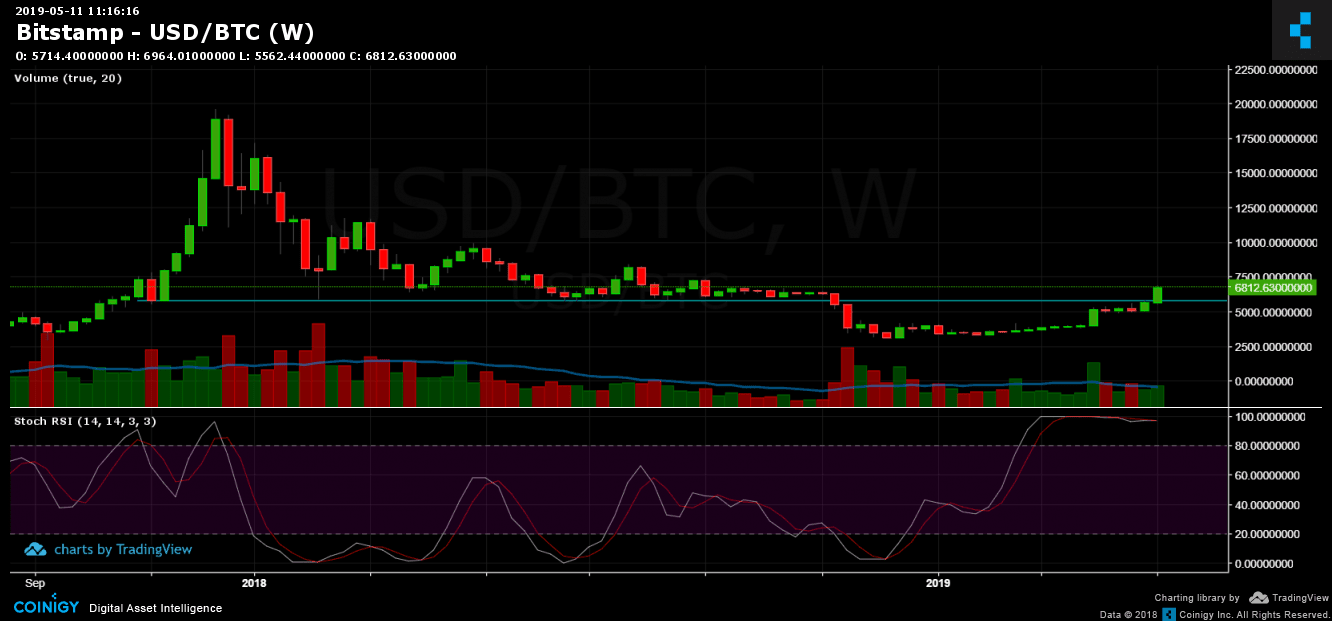
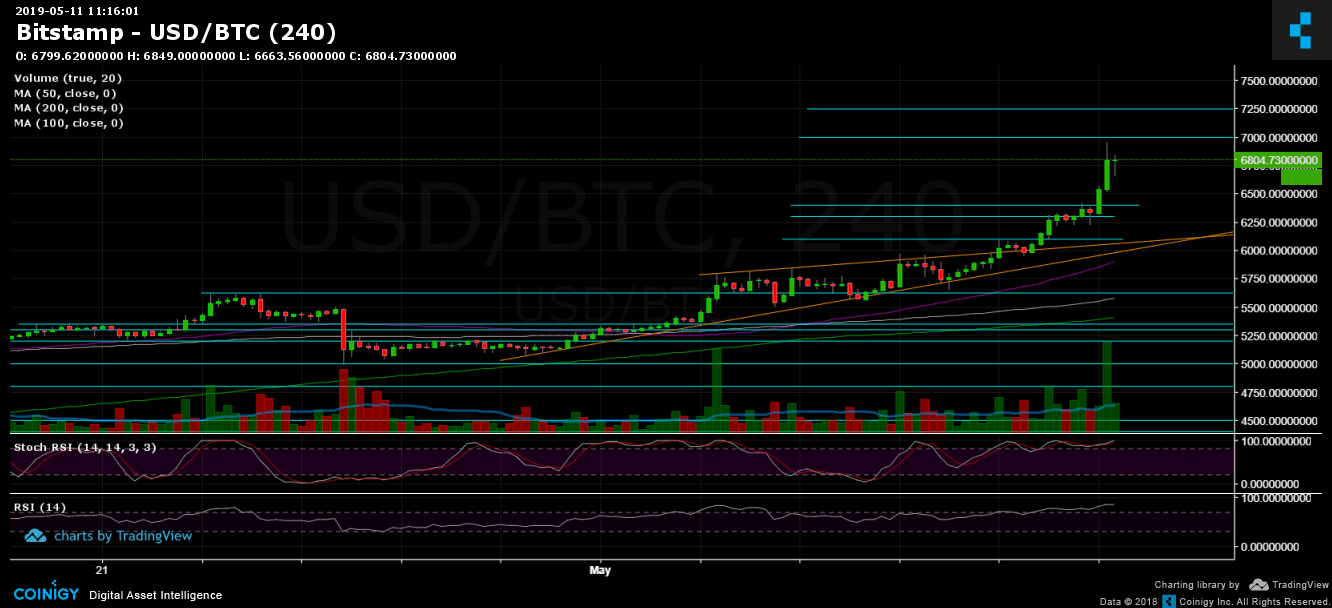
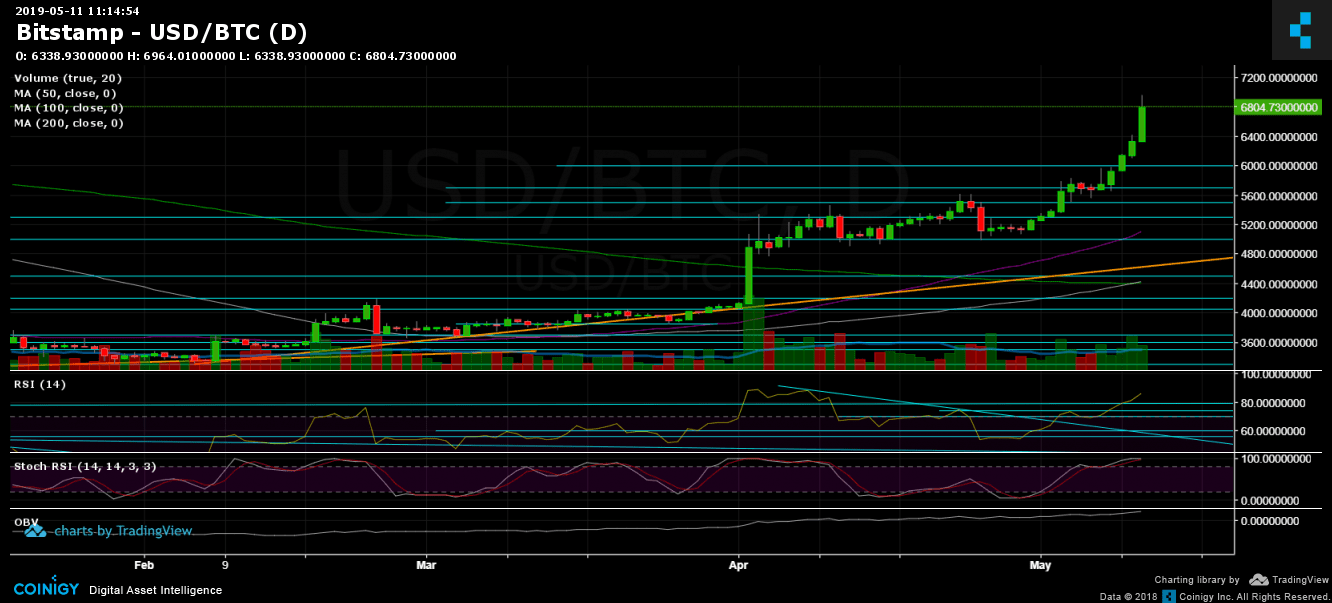
It’s amazing but all targets mentioned in yesterday’s analysis were easily captured, reaching the highest target mentioned at $7000. As of now, Bitcoin is struggling to stay on top the $6800 resistance turned support mark. In the case of a break-up, the next resistance would be $7000. Further higher resistance lies around the $7200 mark, before reaching $7400, which was the previous high of September 2018 (can be seen on the weekly chart).
From the bearish side, there lie the resistance turned support levels: closeby $6800, then $6600 and the significant $6300 – $6400 support area. Further below is $6200 and $6000.
– Trading Volume: As mentioned yesterday, the trading volume of such a breakout was expected to be higher than what we actually saw, this also might be explained because it’s weekend. Another thing to note is that the market cap is slightly increasing; hence, a vast amount of the money is entering Bitcoin is from the crashing Altcoins.
– Daily chart’s RSI: Following the breakout of the 74-75 RSI levels, the indicator seems to be very bullish around 85, nearing the 2019 high level at 88-89. However, the RSI is overstretched in the bullish territory so that a correction will come sooner or later.
– BitFinex open short positions: After reaching their 5-day high at 32.7K BTC open short positions, since yesterday we see a ‘short squeeze’ as the number sharply reduced to 29.2K BTC.
BTC/USD BitStamp 4-Hour Chart
BTC/USD BitStamp 1-Day Chart
The post Bitcoin Touched $7000 – Two Things to Be Worried About: Price Analysis & Overview May 11 appeared first on CryptoPotato.

