Bitcoin Surges to $13K: Those Are The Key Levels On The Road To $20,000 – BTC Price Analysis
As of writing this, Bitcoin just surged to mark $13,000 as its fresh 2019 high: That’s so far, an insane move! Since saying goodbye to the $8,000 level, there was not much correction in Bitcoin.
If you scroll back to the 2017 bull-run, the path is almost identical. Once Bitcoin broke up the ascending wedge pattern, as can be seen on the daily and weekly charts, the coin had ‘fired its engines.’
Whoever followed Bitcoin price for more than two years would remember how a parabolic move looks like. And here we are again.
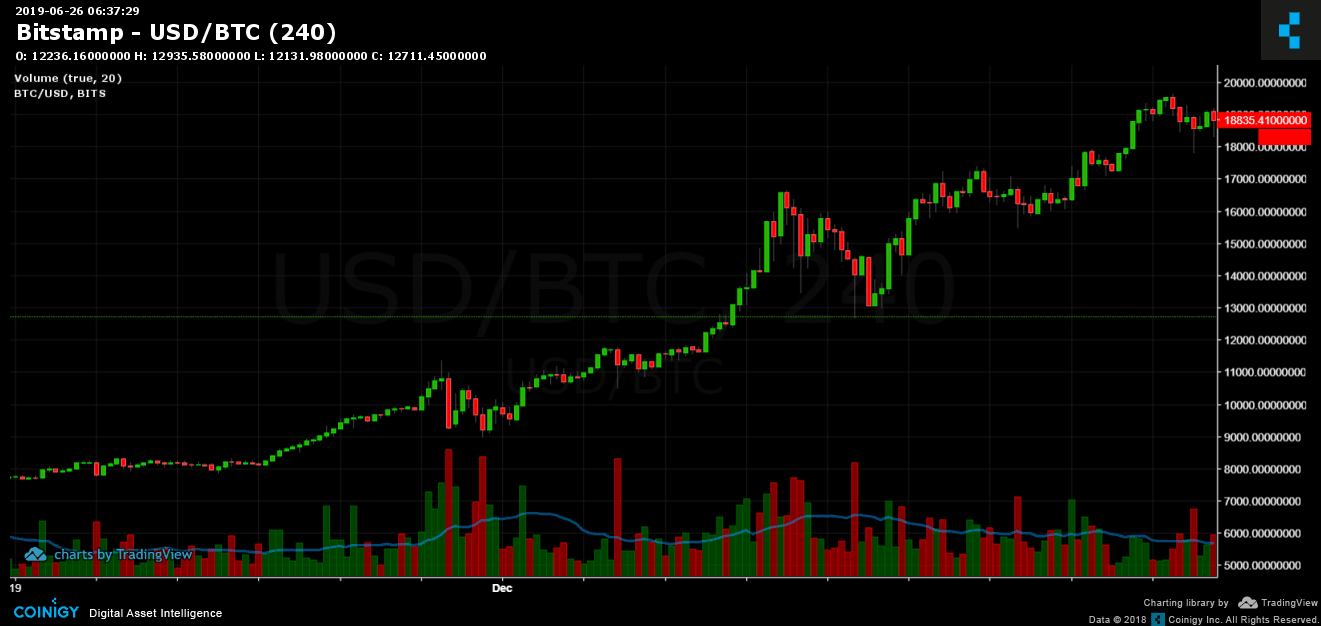
After breaking up $12,000, and to understand what levels could slow down the pace of BTC, let’s look back on those magical 30 days, from mid-November 2017 to mid-December 2017 when Bitcoin produced its road to $20,000:
And here we are now; this is an almost the same 4-hour chart, as of now:
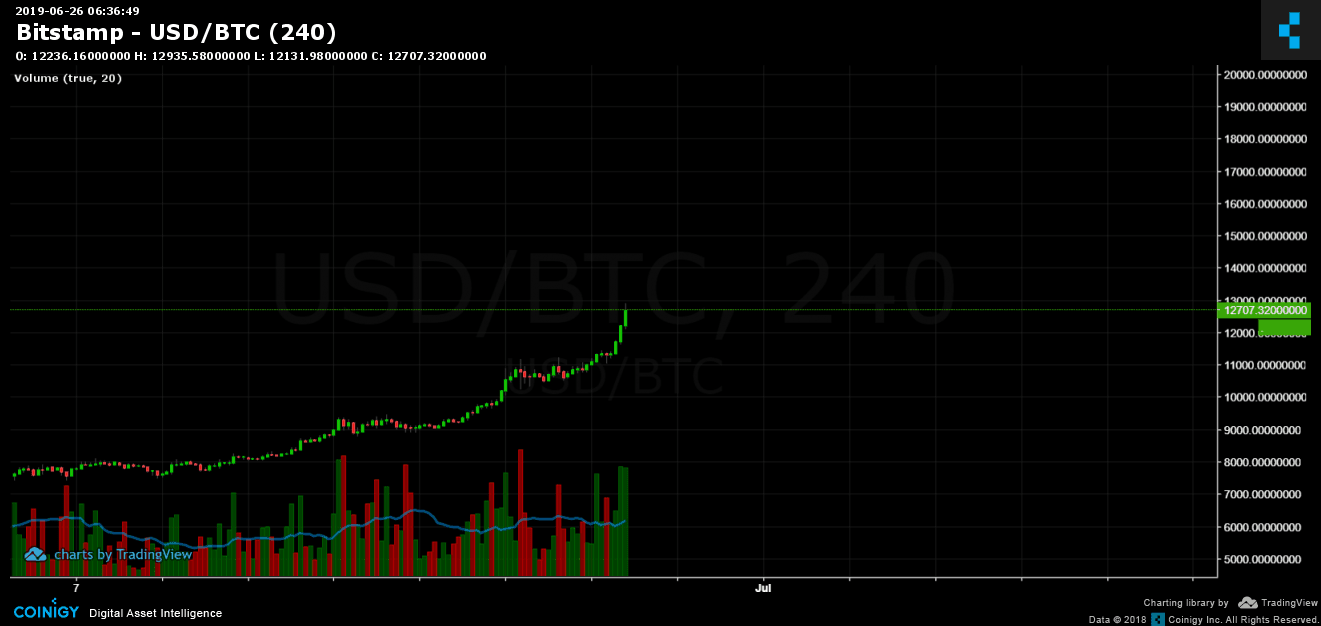
The Road to $20,000
– Support/Resistance:
The closest level of resistance is the $12,500 – $13,000 area we are currently at. The $13,000 was also resistance from January 2018. Breaking the last would likely to send Bitcoin to the $15,000 area since there is not much resistance along the way.
Next targets would be $16,400 – $16,650 zone, which saw the most severe correction during the bull-run of 2017. After reaching $16,650 for the first time (Dec.7,2017), Bitcoin saw $12,800 just two days later.
Next is $17,400 (January 7, 2017, high), $18,000, $19,300 and $20,000. At the last levels, we should expect no trouble for Bitcoin since there was not much resistance, and the bulls would easily give the coin a necessary push to conquer $20,000 again.
From the bearish side, possible levels for support would be the past resistance levels. The nearest level would be $11,800 – $12,000. Besides lies the previous high at $11,200, $10,600, $9,800 – $10,000 and $9,400.
– Daily chart’s RSI: This is exactly how a bull-run looks. The RSI is nearing its yearly high at the 88 – 90 area. This could also trigger a possible correction. If the parabolic move continues, it will be interesting and critical to see the RSI rising. Back in 2017 bull-run, the RSI had produced a negative divergence. This means that the last leg to $20,000 was not followed by enough power or momentum to continue further as the RSI was pointing down.
– Trading Volume: The last move is followed by a decent volume of buyers. The green candles are getting higher as Bitcoin increases, money comes in, a healthy bull trend.
– BitFinex open short positions: The open short positions are gaining momentum along with the rising Bitcoin. There are now 29.2 K BTC of open short positions. This is their highest level since May 11. However, BitFinex will soon go down for a 7-hour maintenance period. This could develop something.
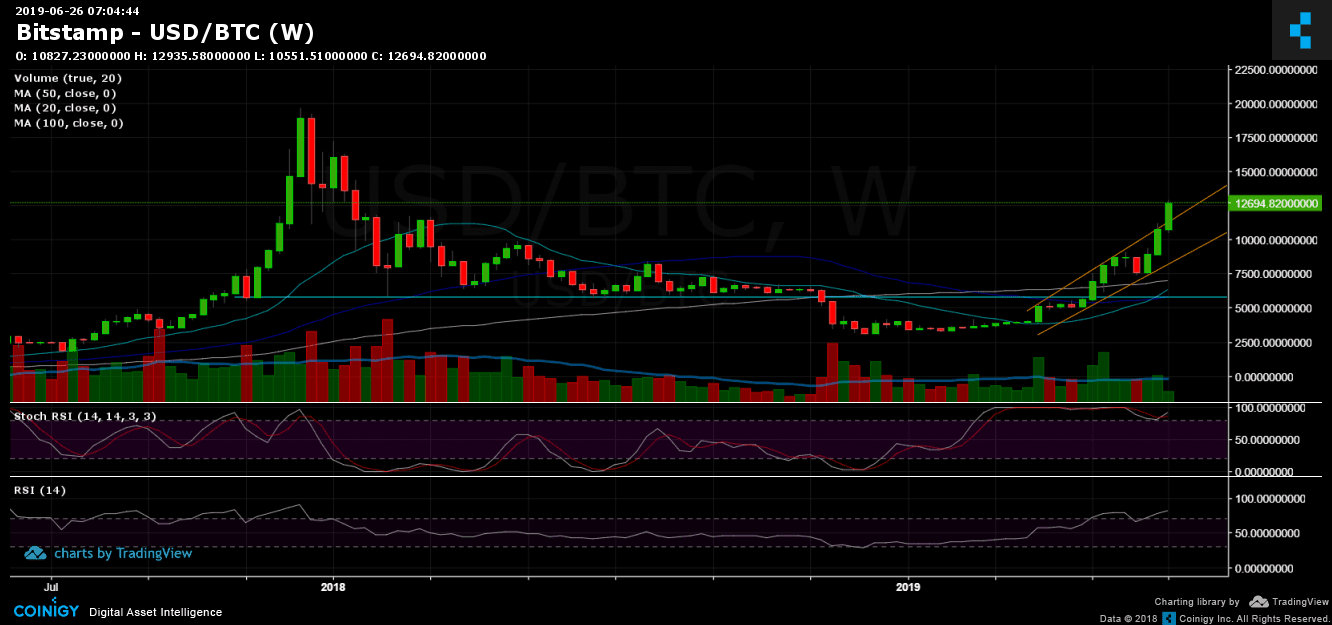
BTC/USD BitStamp 1-Week Chart
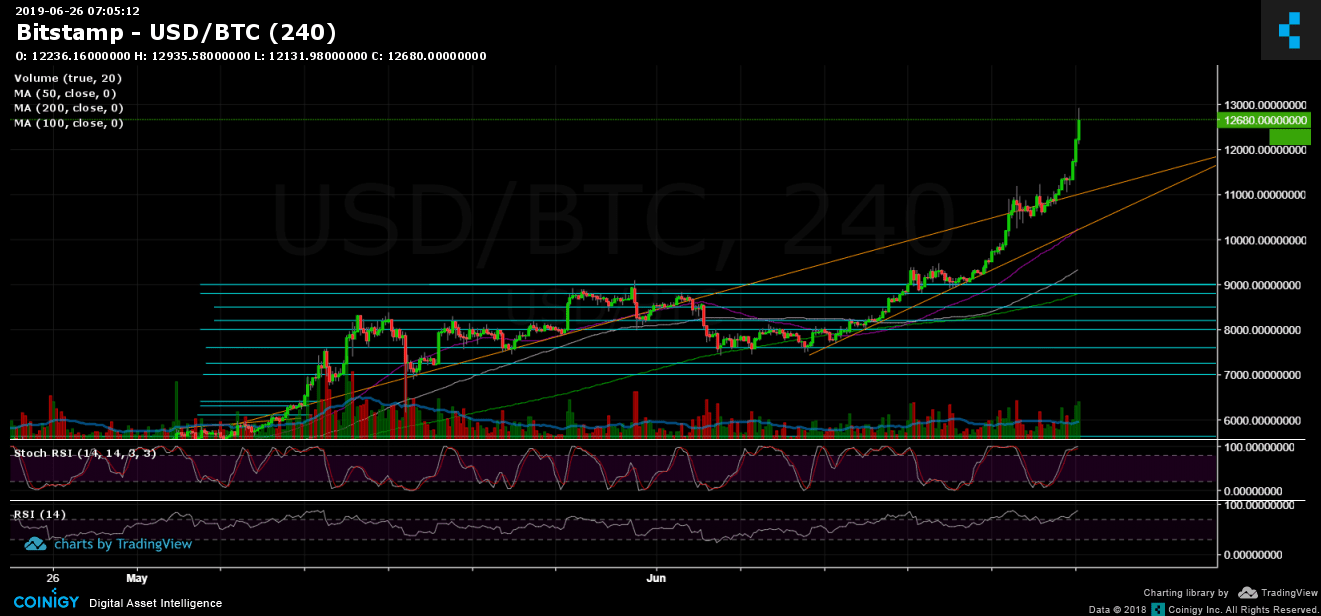
BTC/USD BitStamp 1-Day Chart
The post Bitcoin Surges to $13K: Those Are The Key Levels On The Road To $20,000 – BTC Price Analysis appeared first on CryptoPotato.