Bitcoin Surged $4K Today, Now Facing Critical Resistance Zone (BTC Price Analysis)
Things change quickly in crypto. Just when it seemed like Bitcoin is losing support and saying goodbye to the $30K range, Bitcoin soared a solid 12% over the past 24 hours as the primary cryptocurrency climbed by almost $4K only today. As of writing these lines, Bitcoin is retesting the critical $34,000 level.
However, Bitcoin is now facing crucial resistance at $34K and the upper boundary of the marked triangle, which started forming on January 8, 2021, when Bitocin recorded its current all-time high.
From $30K To $34K In One Day
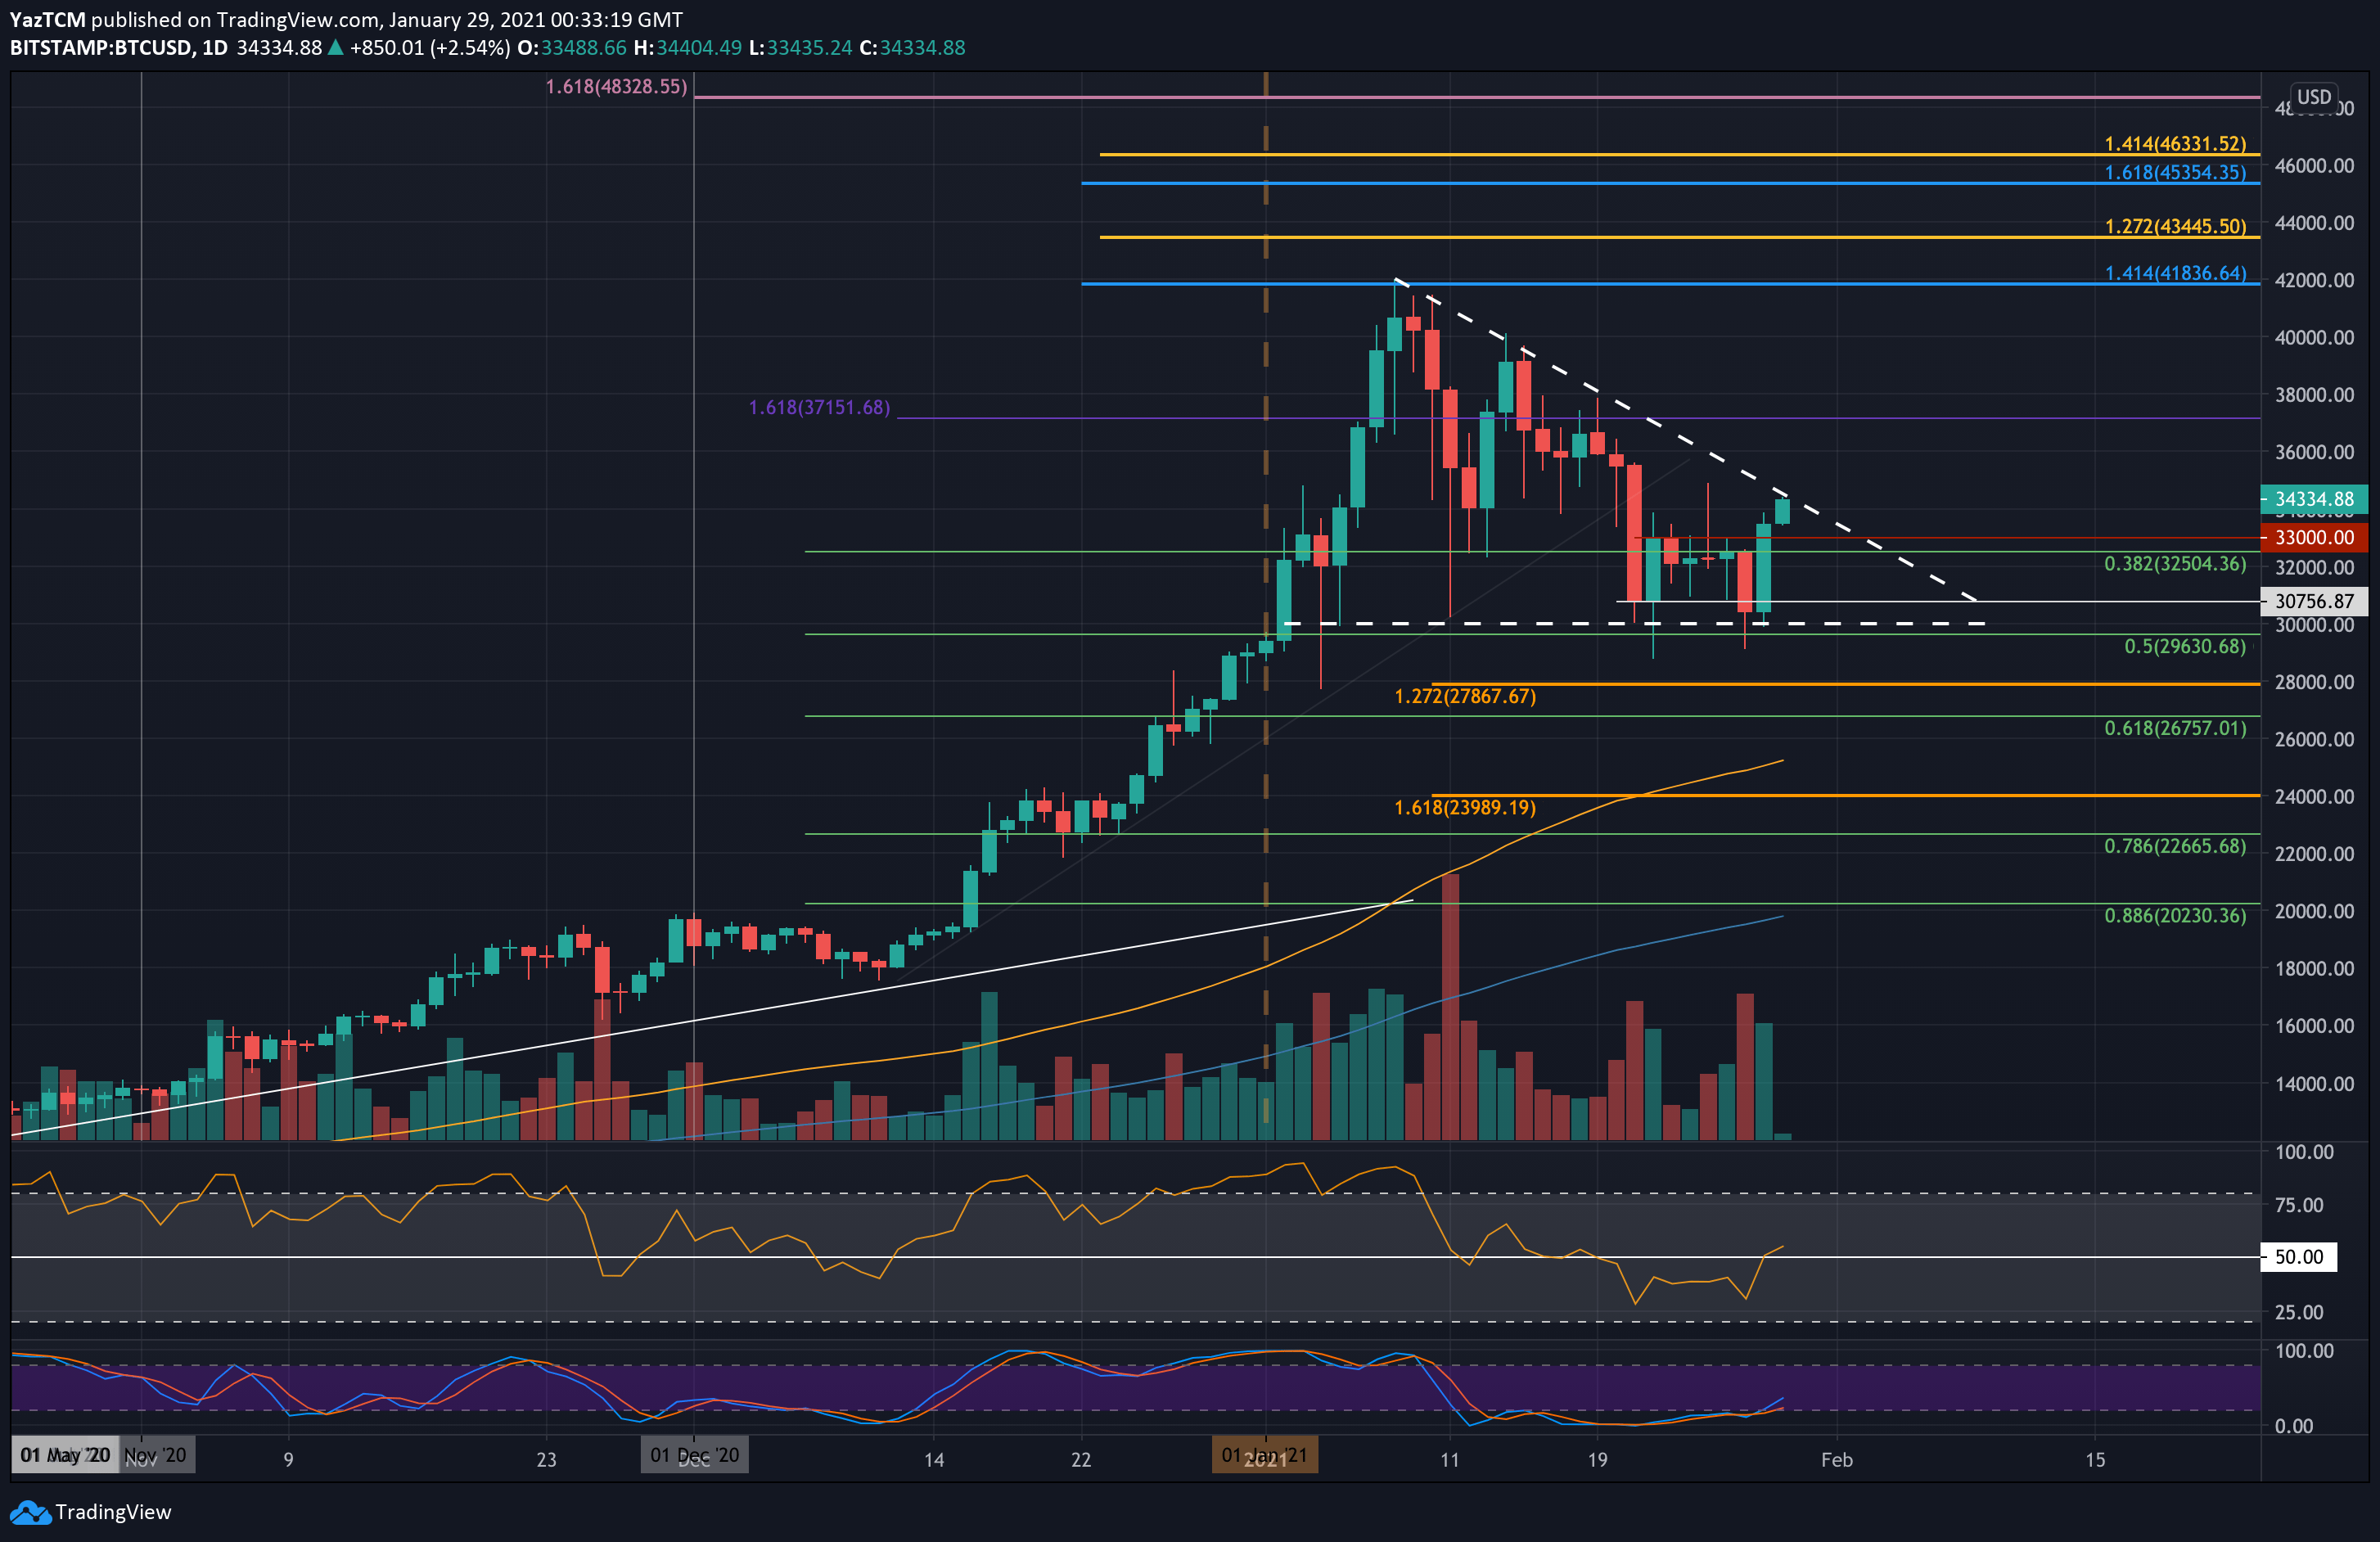
BTC saw a few rough days after dropping by over 10% on Wednesday. It briefly spiked beneath the larger descending triangle, as can be seen on the following daily chart.
During Wednesday’s plunge, BTC fell beneath $30,000 (the base of the triangle), reaching as low as $29,125 before it bounced back, but luckily managed to close the daily candle above $30K, so eventually, the triangle didn’t get broken.
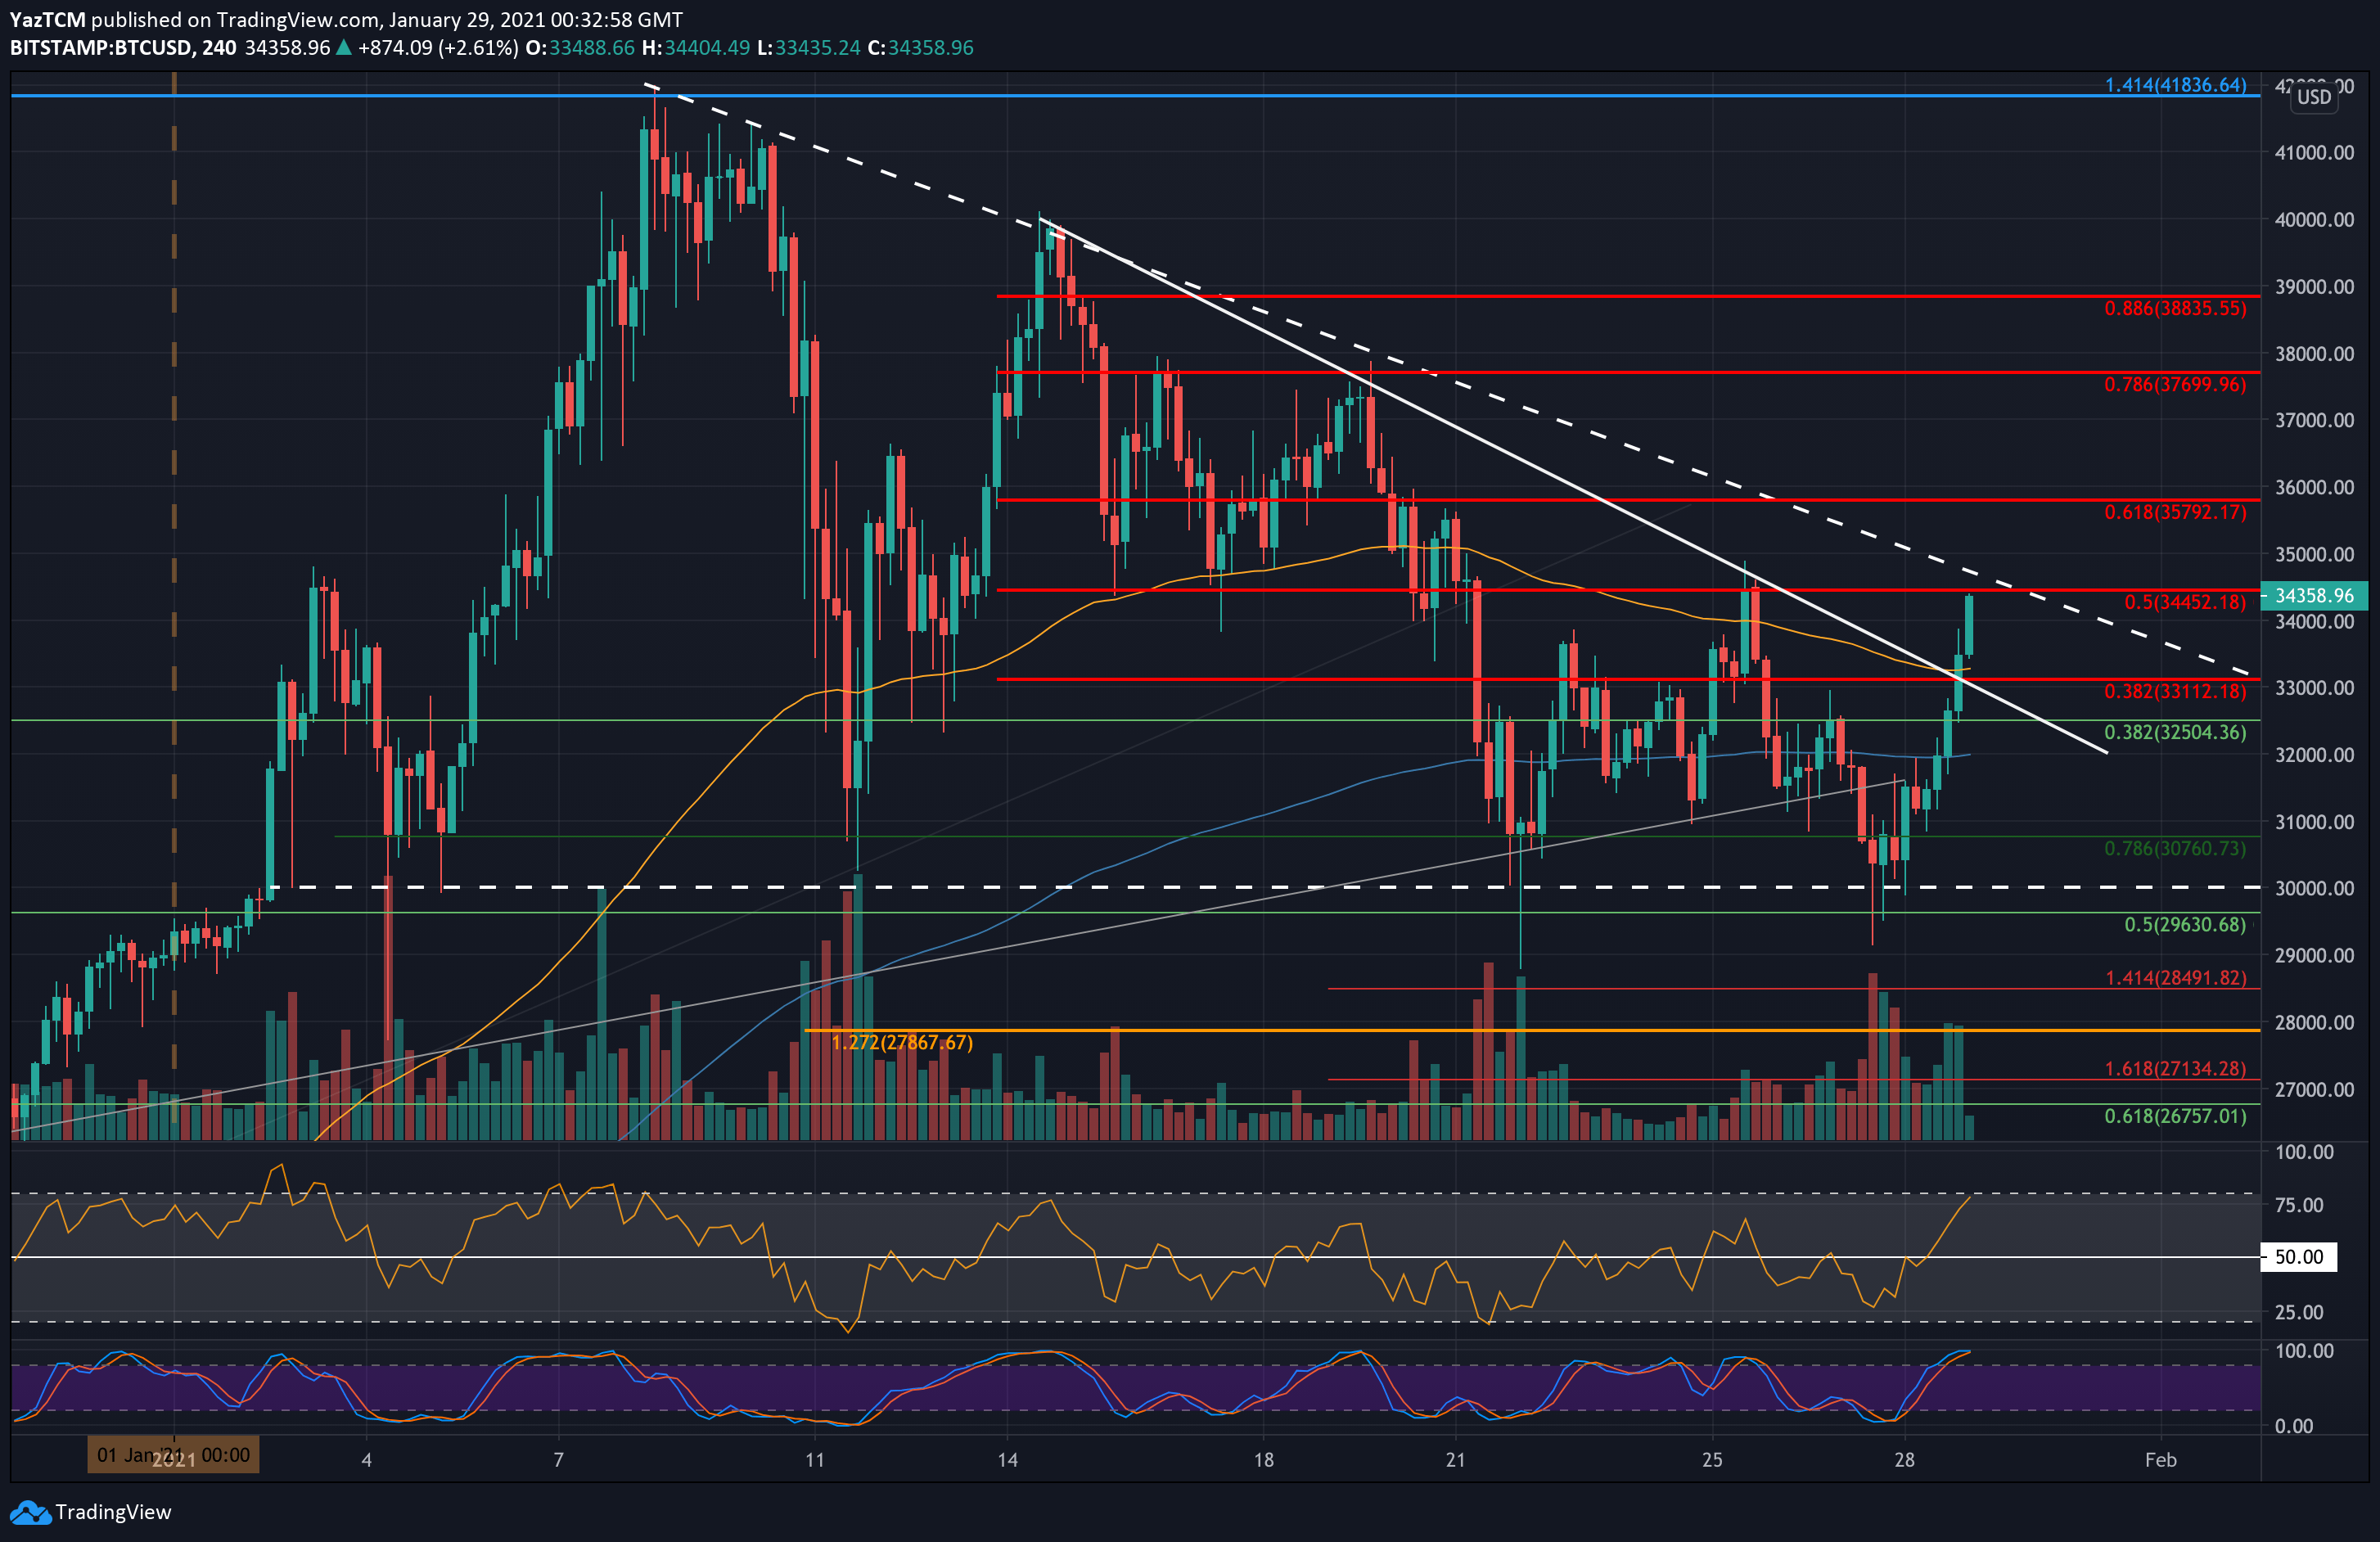
Today’s 12% price increase allowed Bitcoin to break the previous consolidation range between $30,700 and $33,000 that ‘trapped’ BTC over the past week. Bitcoin also broke significant resistance ($33,800) at a short term descending trend line on the 4-hour time frame (4-hour candle close hadn’t taken place as of writing this).
Looking at the bigger picture, Bitcoin is now facing huge resistance at the horizontal level of $34,000, followed by the descending triangle’s upper angle, at around $34,500. A break above and Bitcoin could start planning on a new all-time high.
BTC Price Support and Resistance Levels to Watch
Key Support Levels: $33,100, $32,500, $30,750, $30,000.
Key Resistance Levels: $34,000, $34,450, $35,790, $36,500, $37,700, $38,000.
As mentioned above, the first level of resistance lies at $34K, followed by $34,450 (bearish .5 Fib Retracement, along with the triangle’s upper boundary).
Beyond the triangle, resistance lies at $35,790 (bearish .618 Fib), $36,500, $37,700 (bearish .786 Fib), and $38,000.
On the other side, the first level of support lies at $33,800 (descending trend-line on the 4-hour chart), followed by $32,500 (.382 Fib), $30,750, and $30,000.
The recent price spike allowed the daily RSI to spike above the midline, indicating the bulls have taken control of the market momentum. Also spotted – bullish divergence on the shorter timeframe (4-hour) and on the daily chart).
Bitstamp BTC/USD Daily Chart
Bitstamp BTC/USD 4-Hour Chart