Bitcoin Still Unable To Break $12K – Heading To $15,000 Or $9,000 Before? BTC Price Analysis
Following the impressive breakout of the $11,000 – $11,200 resistance area, we saw Bitcoin engines ignite.
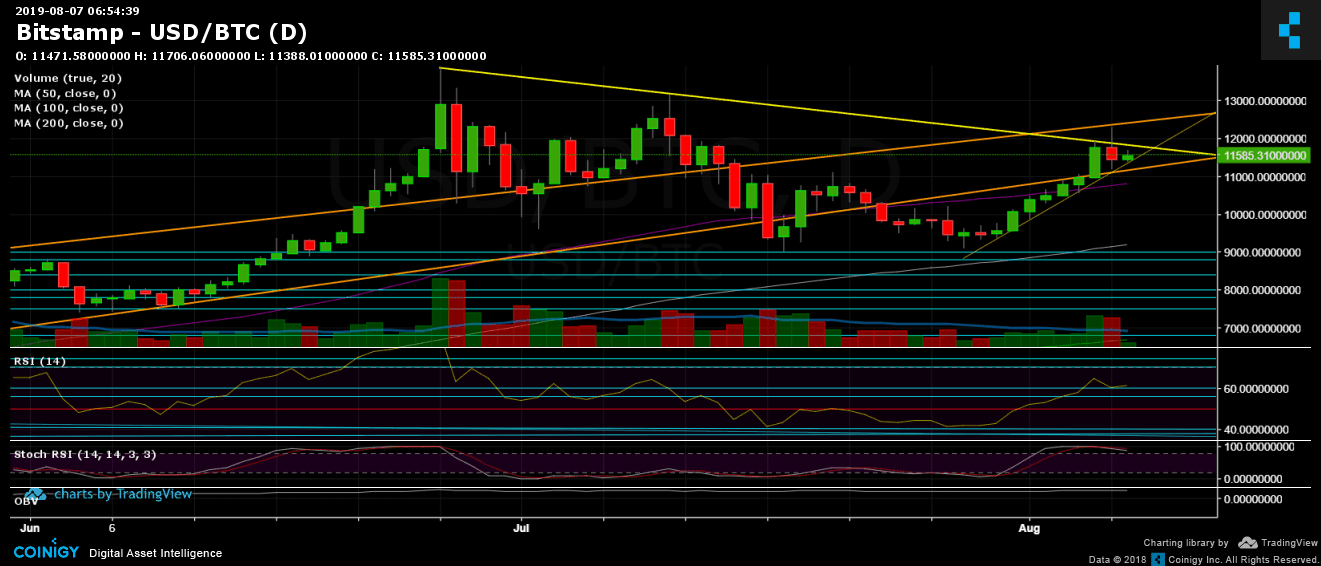
Yesterday, Bitcoin surged to mark $12,300 as its monthly high, and like it can be seen in the following daily chart, it lays exactly on our spotted upper ascending trend-line. Minutes after capturing the record, the coin had seen a massive sell-off, which is a typical behavior – remember the day recording the 2019 high at $13,880 and quickly losing momentum?
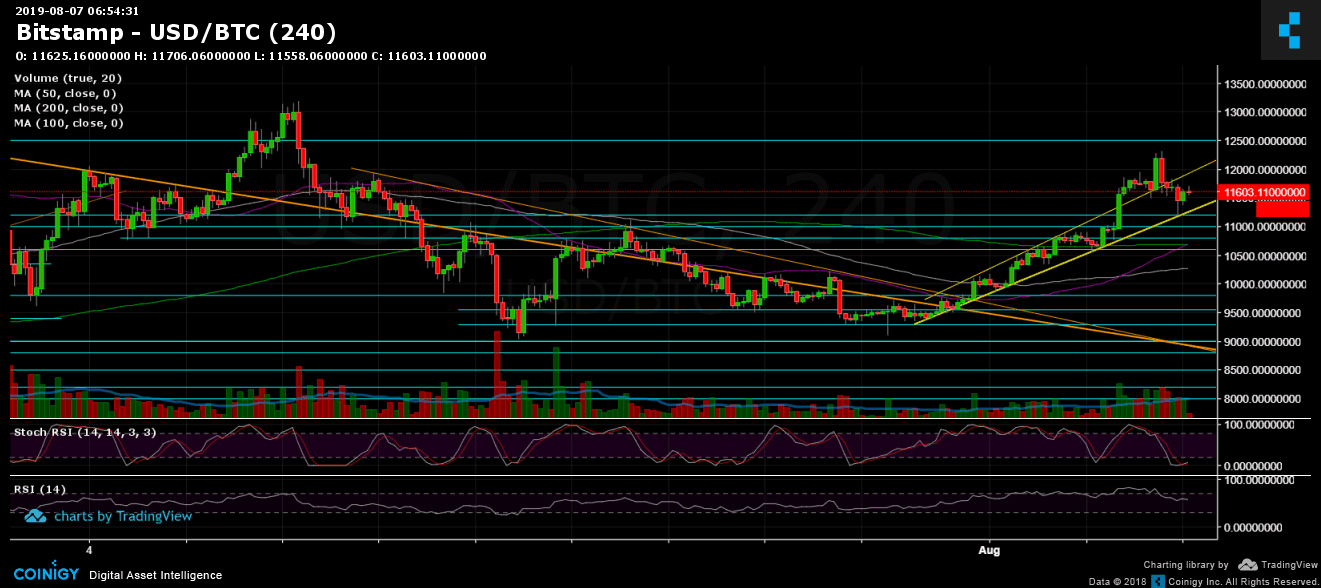
After losing more than $1,000 intraday, Bitcoin found support at the short-term ascending trend-line (marked by yellow on the following 4-hour chart), along with the above mentioned $11,000 – $11,200 area, now as support.
In conclusion, Bitcoin got rejected trying to break-up the descending trend-line (marked yellow on the daily chart), which formed from the previous 2019 Bitcoin local highs at $13,880 and $13,200.
The bigger picture now seems to be the $11,000 resistance turned support from below, whereas the $11,800 – $12,000 from above, which contains the descending yellow trend-line on the daily chart.
We can look at the technical analysis all day. However, the fragile economic situation of the global markets can speed things up in favor of Bitcoin. We already saw what a little Donald Trump tweet could cause. This year, more than ever, it seems like more and more investors see Bitcoin as a legitimate method of hedging to their portfolio.
Total Market Cap: $304 billion
Bitcoin Market Cap: $207 billion
BTC Dominance Index: 68.3%
*Data by CoinGecko
Key Levels to Watch
– Support/Resistance:
Bitcoin is back down, facing the $11,500 – $11,600 area, which has a lot of demand and supply. The next level of resistance from above, as mentioned, lies at $11,800 to $12,000. This contains the 2019-high descending trend-line marked in yellow on the daily chart. The following resistance will then be yesterday’s high at $12,300, before further resistance level at $12,500, in case of a breakup, the next target will be the current 2019 high areas around $13,500 – $13,880.
From below, the nearest support area lies at the current price area. Further down is the descending trend-line resistance turned support at $11,150 (where Bitcoin found support yesterday). Below is the $11,000, followed by the good “old” $10,500 – $10,600 (from yesterday).
– Daily chart’s RSI: The RSI failed in breaking up the 64 level, and quickly found support on the 60 level. As stated in our previous analysis, the indicator is showing strength and supports the recent bullish momentum.
– Trading Volume: Finally, we saw some volume. The past two days were the highest volume days since July 18. The breakout is real; the bulls are in the market.
BTC/USD BitStamp 4-Hour Chart
BTC/USD BitStamp 1-Day Chart
The post Bitcoin Still Unable To Break $12K – Heading To $15,000 Or $9,000 Before? BTC Price Analysis appeared first on CryptoPotato.


