Bitcoin Steady But Fragile: Will The Volatile Weekend Plunge BTC Price To $8,500?
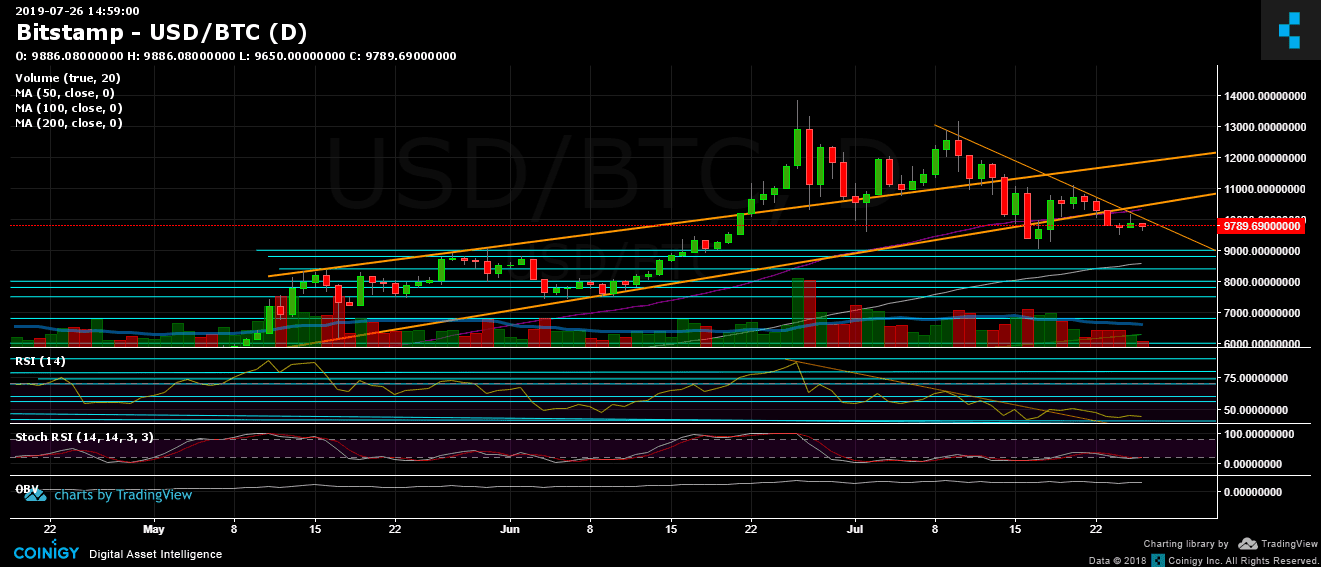
Since our previous price analysis and over the past three days, Bitcoin was trading in the tight range of $9600 from below to $10,200. The top of that level is exactly where lies the 50-days moving average line (marked purple on the following daily chart).
Over those days, there was not much volume surrounding the BTC trading, however, since reaching the 2019 high at $13,880 Bitcoin is showing bearishness, creating lower lows. The recent test of $11,000 a week ago had failed and got rejected. Until getting back, breaking up the last, and forming a lower high – it will be hard seeing Bitcoin showing bullishness.
Another evidence to the bearishness is the RSI, which is showing weakness under the crucial 50 level (daily chart) at the bearish territory with much room to go down.
Bitcoin is getting to the weekend steady and calm, however, as mentioned above, things can get change very quickly. As we notice from before, Bitcoin loves creating sharp moves during weekends.
Total Market Cap: $272 billion
Bitcoin Market Cap: $175 billion
BTC Dominance Index: 64.4%
*Data by CoinGecko
Key Levels to Watch
– Support/Resistance:
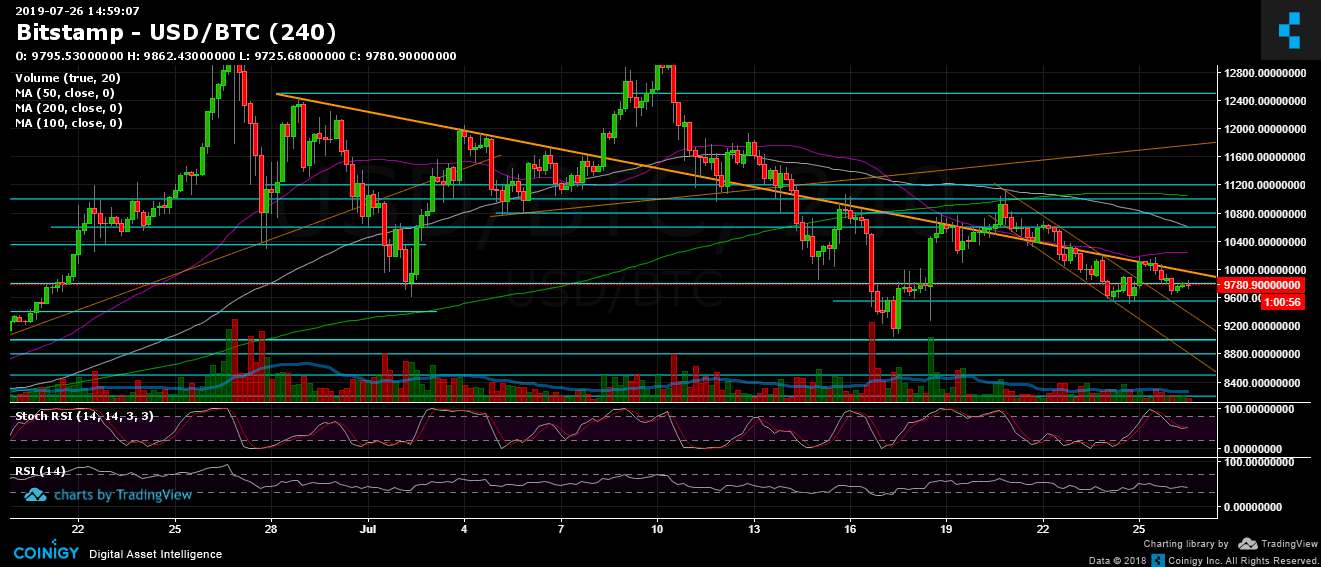
Looking at the 4-hour chart, Bitcoin is following a descending trend-line which had started forming a month ago. The last rejection was yesterday at around $10,200. That line, along with the $9,800 – $10K price area, is the closest resistance level from above. Next is the mentioned 50-days moving average line (~$10,200) before getting back to the $10,500 – $10,600 region. Further above is the previous daily high at $11K.
From below, Bitcoin is now facing support level at $9500 – $9600. Further below is $9400, before getting to the $9000 area. Lower levels are the $8800 $8500 significant support line (along with CME’s futures gap).
– Daily chart’s RSI: Discussed above.
– Trading Volume: Discussed above.
BTC/USD BitStamp 4-Hour Chart
BTC/USD BitStamp 1-Day Chart
The post Bitcoin Steady But Fragile: Will The Volatile Weekend Plunge BTC Price To $8,500? appeared first on CryptoPotato.