Bitcoin Starts Thanksgiving Losing $1000 in Three Hours
So you bought some Bitcoin this week? How about a big red candle to celebrate Thanksgiving?
After showing the fastest growth of the year, Bitcoin finally corrected, losing over $1000 in about 3 hours.
At 0:00 UTC, Bitcoin was trading at $18869 on Coinbase. The price represented a breath of fresh air for traders and Bitcoin enthusiasts who were expecting a new ATH but were surprised by a downward correction on the afternoon of November 25th.
Bitcoin embarked on a sharp correction, losing around 12% of its value in 48 hours just after hitting exactly $19500 on Coinbase.
Bitcoin is Still Respecting the Bullish Trend
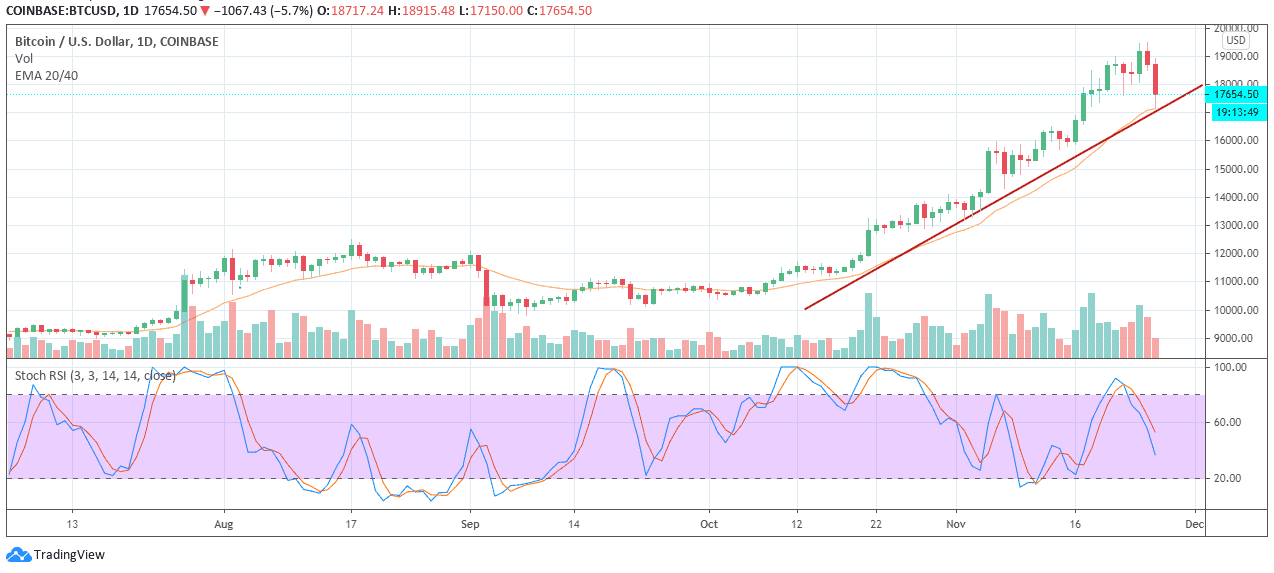
Although the asian bears seem to be in control, the truth is that charts show multiple indicators that project some peace of mind. Bitcoin bounced right off the EMA 20 line, indicating that the bullish trend is still likely to continue.

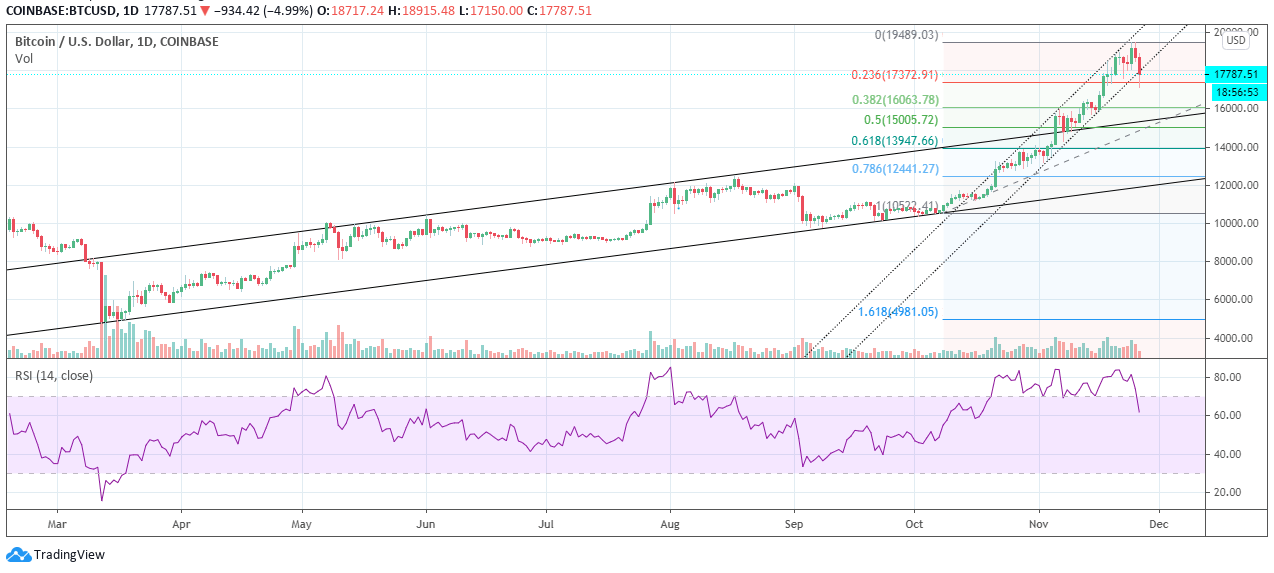
The RSI seems to be back to normal. Admittedly it is still high at 61.14, but the drop from the 83.88 just a few hours before the crash may be a breath of fresh air for traders who were nervous about a massive sell-off.
The next hours will be crucial to know whether bitcoin is finally leaving its bullish channel and coming back down to earth, or if the drop is just a short break before continuing the bullish trend that has been going on since approximately mid-October 2020.
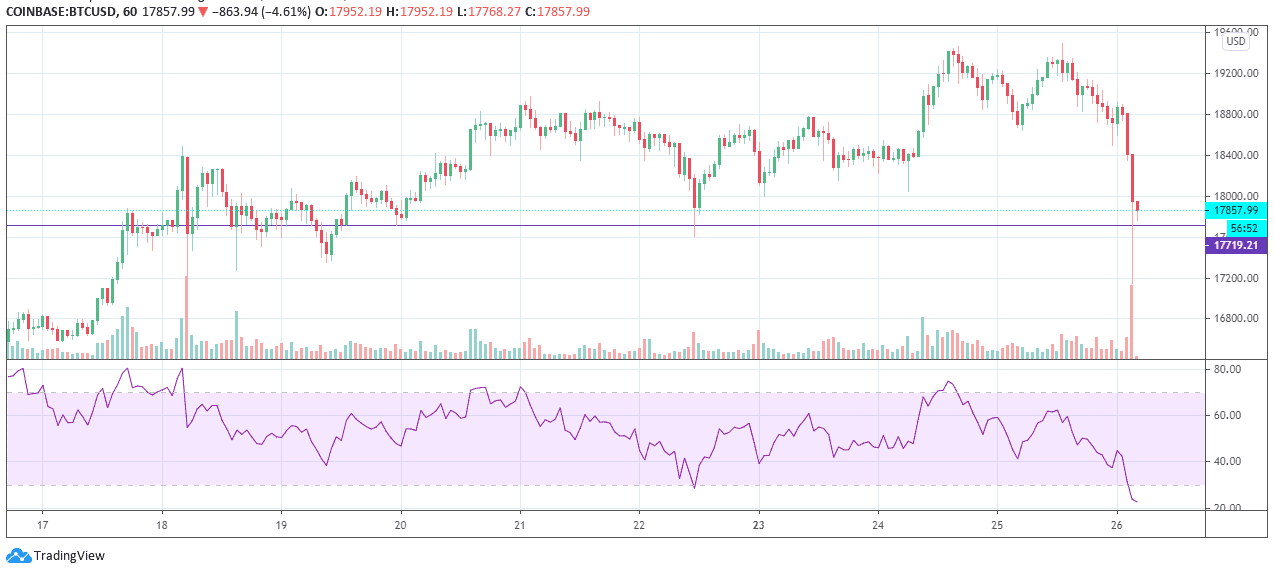
As far as the scalpers are concerned, things look relatively stable after the bloodbath. Bitcoin has held steady over the $17,700, and the Asian markets have reported large trading volumes whilst respecting the trend parameters in more extended time frames.

The RSI showed a drastic variation at an oversold level not seen for almost two months. The Stochastic RSI also showed a similar drop to very low levels, which could be taken as a buy signal for those operating in slightly longer time frames.
However, Bitcoin could continue to fall in a bearish scenario and test the first support at around $17300. From that point on, the next stops would be at $16063 and $15005 before returning to the bullish channel zone it has held since March 2020.

Most of The Altcoins Are Also in Pain
Things are not looking good for the rest of the altcoins either. According to data from Coinmarketcap at least 95% of the top 100 tokens —leaving aside the stablecoins— are registering losses in the last 24 hours; however, many tokens are still up since last week.
By the time of writing this article, Ether (ETH) lost 9.5%, XRP crashed over 12%, Bitcoin Cash (BCH) dropped 13.69% and Cardano (ADA) 14.5%. The hottest DeFi are in the red zone too: Chainlink (LINK) reported losses of 16.42%, Uniswap (UNI) -14.16%, AAVE -12.38% and Yearn.finance (YFI) -10.11%. Ouch!
But, even if the correction remains, there is still a lot of room to maneuver before starting to talk about a new bearish market.
Howver, everything can happen in the crypto-verse.


