Bitcoin Soars to $18K But How High Can it Continue? (BTC Price Analysis)
This week’s CPI announcement was a significant relief for Bitcoin investors, as declining inflation would likely lead to a bullish trend for risk assets. However, there is still room for caution from a technical analysis standpoint, as the price has yet to break any major resistance level.
Technical Analysis
By: Edris
The Daily Chart
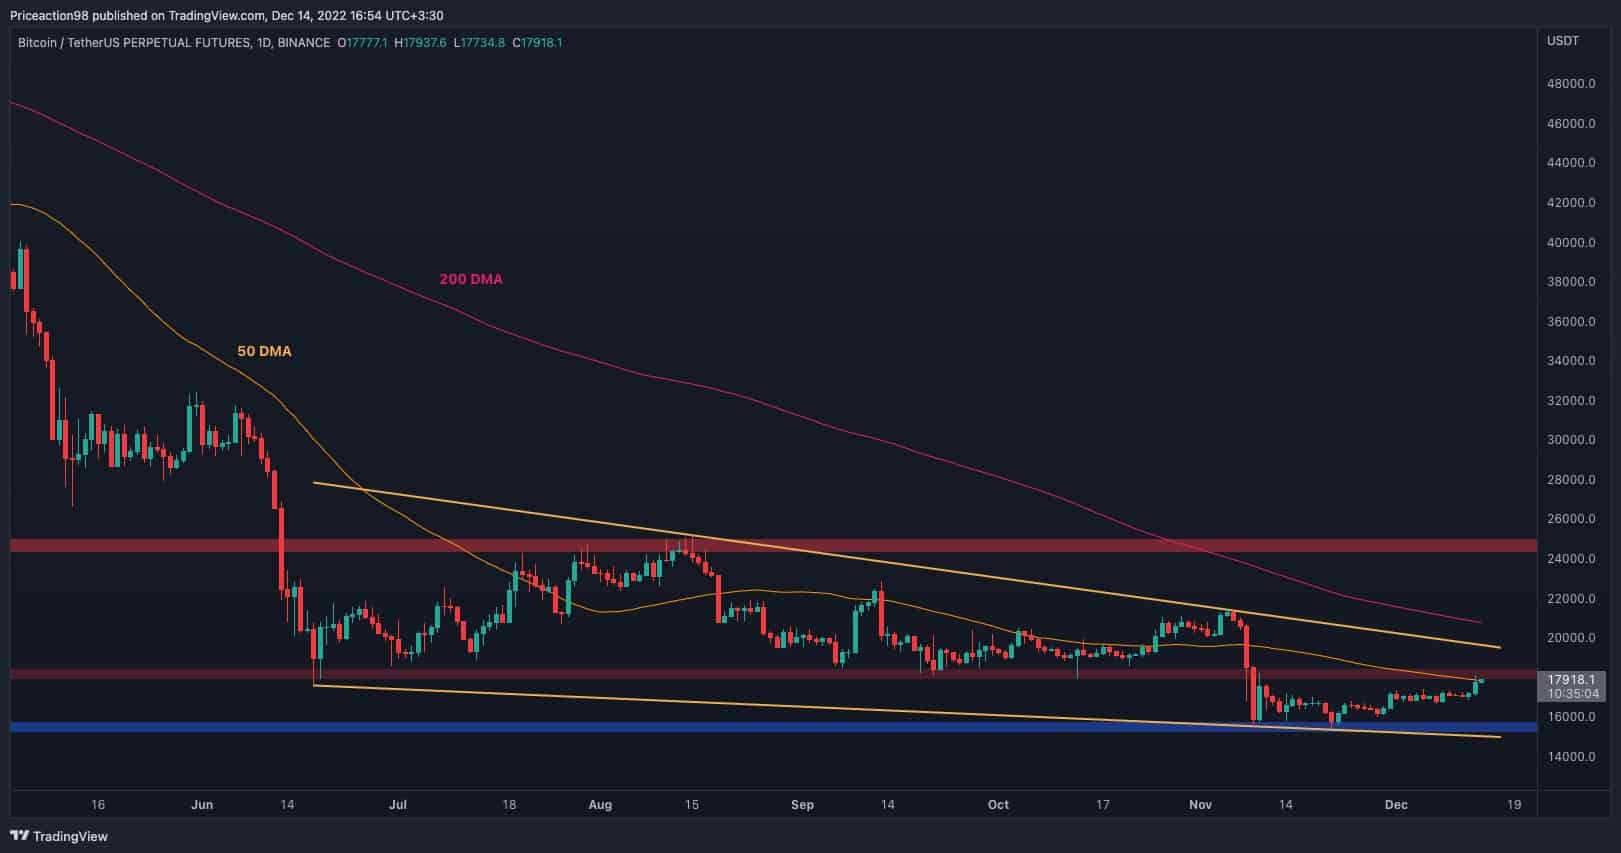
On the daily timeframe, the price has finally reached the $18K resistance area and is currently trying to break it to the upside. The 50-day moving average, located around the same price, is providing additional resistance at the moment.
It’s important to note that a bullish breakout from this significant resistance level could likely lead to a further rally towards the higher boundary of the large descending channel around the $20K mark.
In opposition, if the price gets rejected to the downside, a rapid decline toward the $15K support area would be probable, as there would be no obstacle to holding the price on this timeframe.
The 4-Hour Chart
Looking at the 4-hour chart, the price has finally broken above the $17K mark and is testing the $18K resistance. A breakout from the mentioned level could pave the way for a surge toward $21K in the short term.
However, the RSI indicator is already showcasing a red flag, as the indicator is deep into the overbought area, currently trending around the 80% mark. This signal could point to a pullback or bearish reversal in the coming days, leading to a likely retest of the $17K area.
Considering the relatively high likelihood for the Feds to ease back on the rate hikes and the price’s recent bullish momentum, a breakout above $18K would be the more probable outcome.
The RSI overbought signal should not be taken lightly, especially until the price still trades below the mentioned $18K resistance level.

The post Bitcoin Soars to $18K But How High Can it Continue? (BTC Price Analysis) appeared first on CryptoPotato.