Bitcoin Soars Above $70K, Eyes New All-Time High but There’s a Catch (BTC Price Analysis)
Bitcoin’s price seems to be on the verge of creating a new all-time high, as only one significant resistance zone is standing in its way.
Technical Analysis
By TradingRage
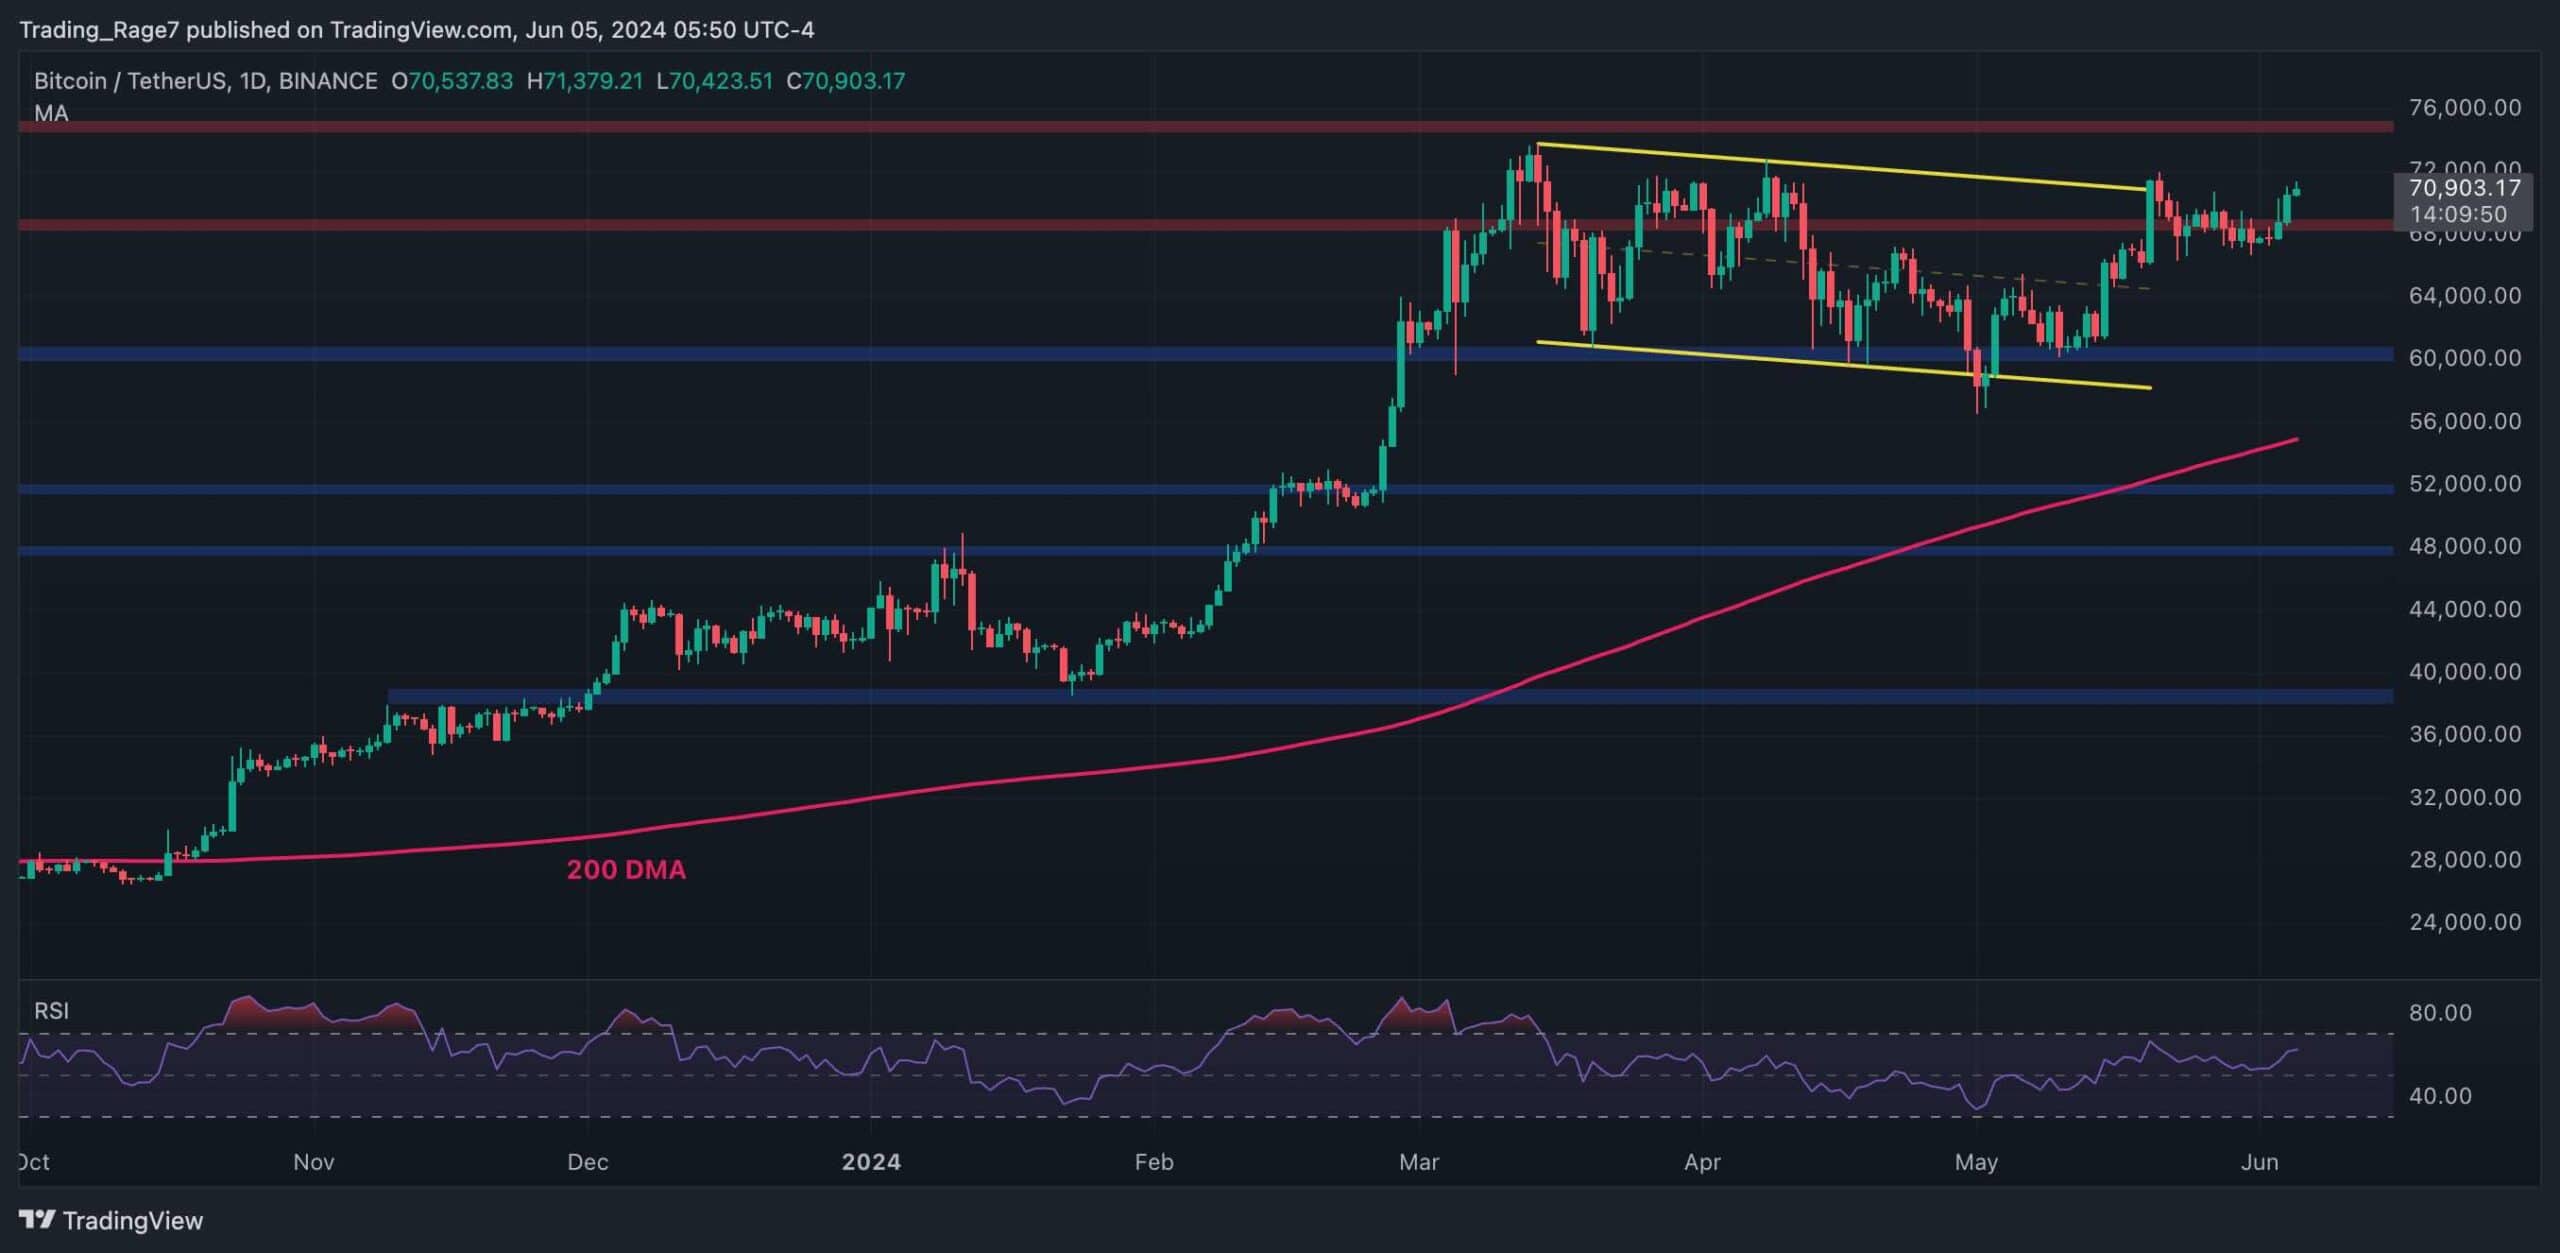
The Daily Chart
The price has been tested to the higher boundary of the large descending channel and the $69K resistance level in the daily timeframe. If it successfully breaks this zone to the upside, the market can run toward the $75K ATH and even create a new record high.
With the Relative Strength Index also showing values above 50%, the momentum is in favor of a bullish continuation and it could only be a matter of time before BTC starts to rally again.
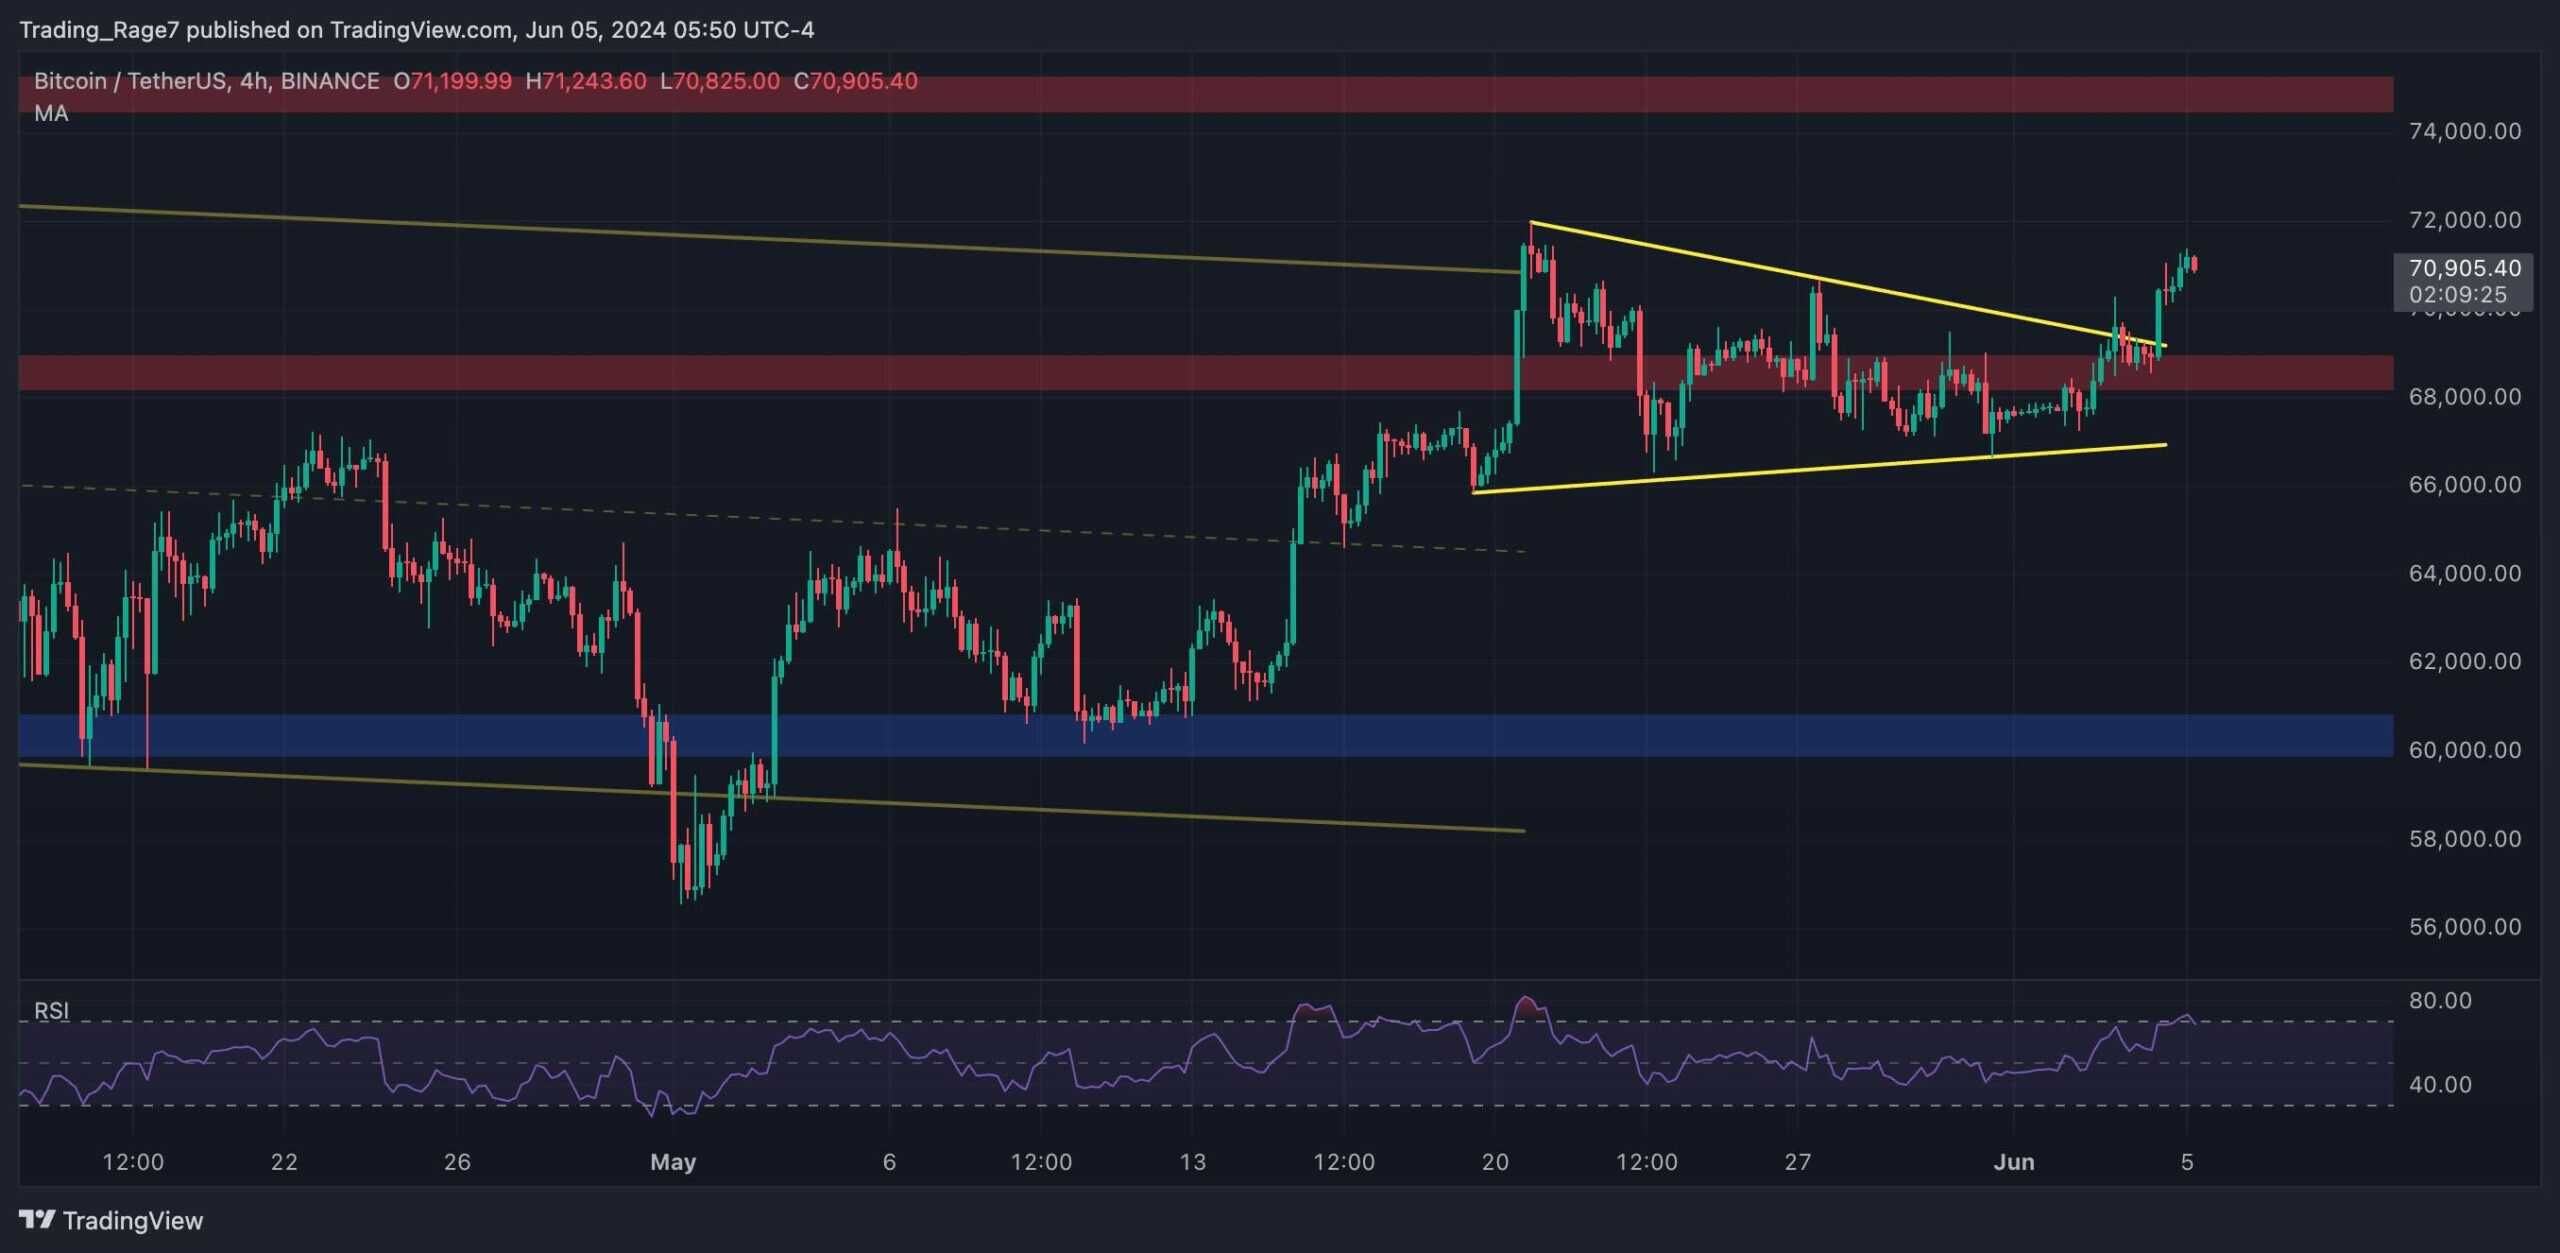
fThe 4-Hour Chart
Things are a bit trickier on the 4-hour timeframe. The price has struggled to keep above the $69K resistance level and has been consolidating inside a symmetrical triangle pattern.
Yet, the higher trendline of the pattern has been broken recently. This means that a new all-time high is almost imminent.
Yet, a deep decline toward the $60K support level could be expected if the price drops back inside the triangle pattern. Meanwhile, the bullish scenario is more likely at the moment.
On-Chain Analysis
By TradingRage
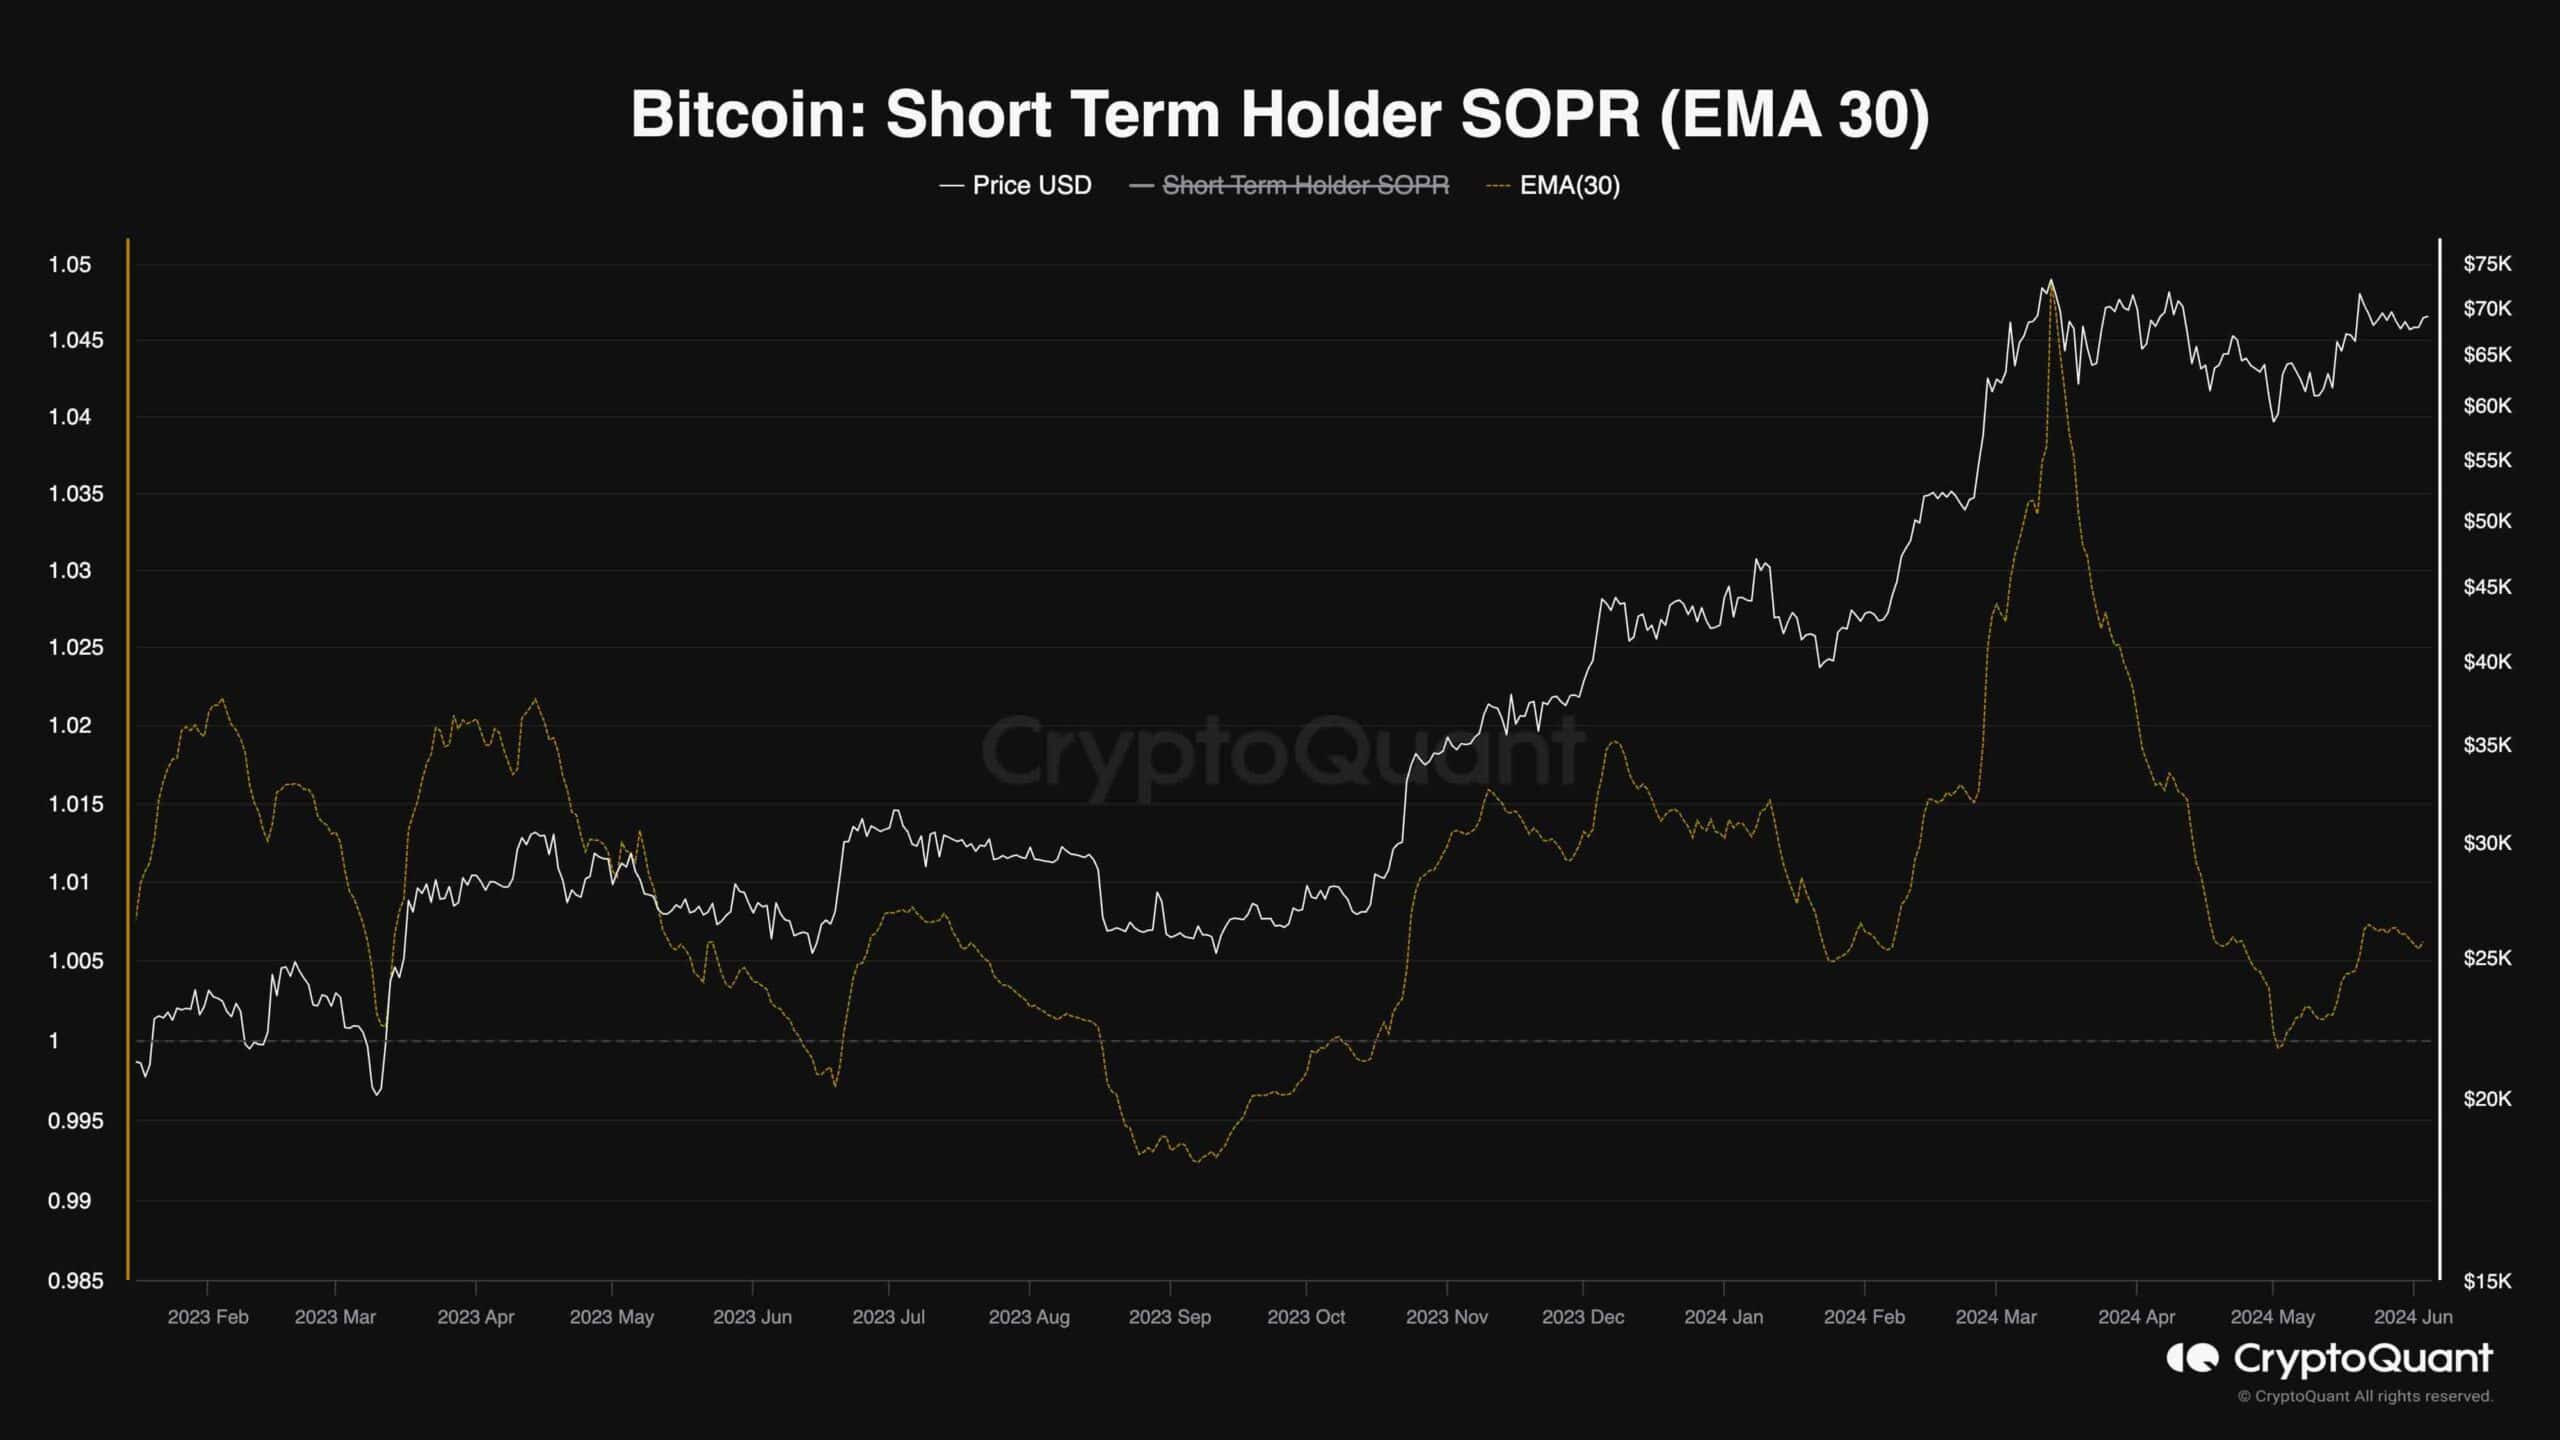
Bitcoin Short-Term Holder SOPR
While Bitcoin’s price is approaching its all-time high around the $75K level, market participants wonder if the market is overheating again. Analyzing the Short-Term Holder SOPR could yield the answer to this question.
The Short-Term Holder SOPR is an on-chain metric that measures the ratio of realized profits and losses. Values higher than one show profit realization, while values below one are associated with realizing losses on aggregate by short-term holders. Note that short-term holders are investors who have held their coins for less than 155 days.
This chart demonstrates the 30-day exponential moving average of the STH SOPR metric. As evident, the metric shows values above one, pointing to profit realization by investors. However, these values are much smaller than those witnessed during the $75K all-time high. Therefore, the market has cooled down compared to March, and a sustainable rally could be shaping up soon.
The post Bitcoin Soars Above $70K, Eyes New All-Time High but There’s a Catch (BTC Price Analysis) appeared first on CryptoPotato.