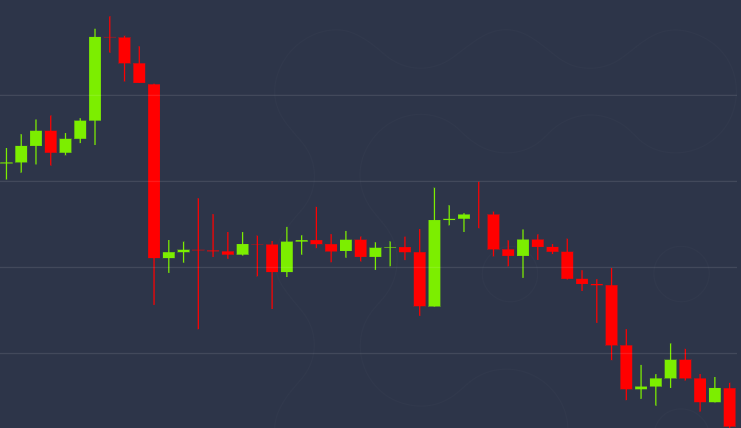
Bitcoin Slumps Under $26K as Bearish Outlook Engulfs Crypto Market
Bitcoin (BTC) dipped under $26,000 in European morning hours on Monday amid a generally bearish sentiment among crypto traders and the lack of new catalysts to rally markets.
BTC fell as low as $25,886 on Binance, CoinGecko data shows, before slightly recovering. Major tokens XRP, cardano’s ADA, and solana’s SOL fell as much as 2.2%, continuing a downtrend since last week.
Ether (ETH) fell 1.1% even as trading aggregator protocol 1Inch invested over $10 million worth of stablecoins from its treasury to purchase 6,088 ETH late on Sunday, providing some buying pressure to an otherwise tepid market.
The drop in majors came even as traditional markets buoyed on Monday, with Shanghai Composition and Nikkei 225 finishing more than 1%, Singapore adding 0.73% and European indices opening up to 0.36% higher.
Meanwhile, FxPro trader Alex Kuptsikevich told CoinDesk in a note that the firm expected further declines, citing price-chart data.
“The technical picture for Bitcoin remains bearish on weekly timeframes, as the price is below its 200-week average and outside of its ascending channel,” Kuptsikevich shared. “The most likely short-term outlook is for a decline to the $23.9-24.6K region.”
On a price chart, an ascending channel is a price pattern made by higher highs and higher lows – with a break below this suggesting bearish price action among traders.
As such traders have remained bearish since the start of August: Futures traders are positioning for a bearish market while options activity shows traders expect a further downside.
Edited by Parikshit Mishra.


