Bitcoin Skyrockets To $6300, Over $1K In 7 Days: Price Analysis & Overview May 10
Over the past three days, since our previous Bitcoin price analysis, the primary cryptocurrency saw extreme bullish volatility.
The coin is used to be volatile, but during 2018 Bitcoin proved to be the new gold with almost no movement on the daily. The outcome of such volatility could be seen on the Altcoins. Ethereum, Ripple, BNB and all the rest are suffering hard during the past month since Bitcoin started it’s run.
Where is the top? No one knows. All the HODLers are glad they held the coin during its 80% something decreases in late 2018.
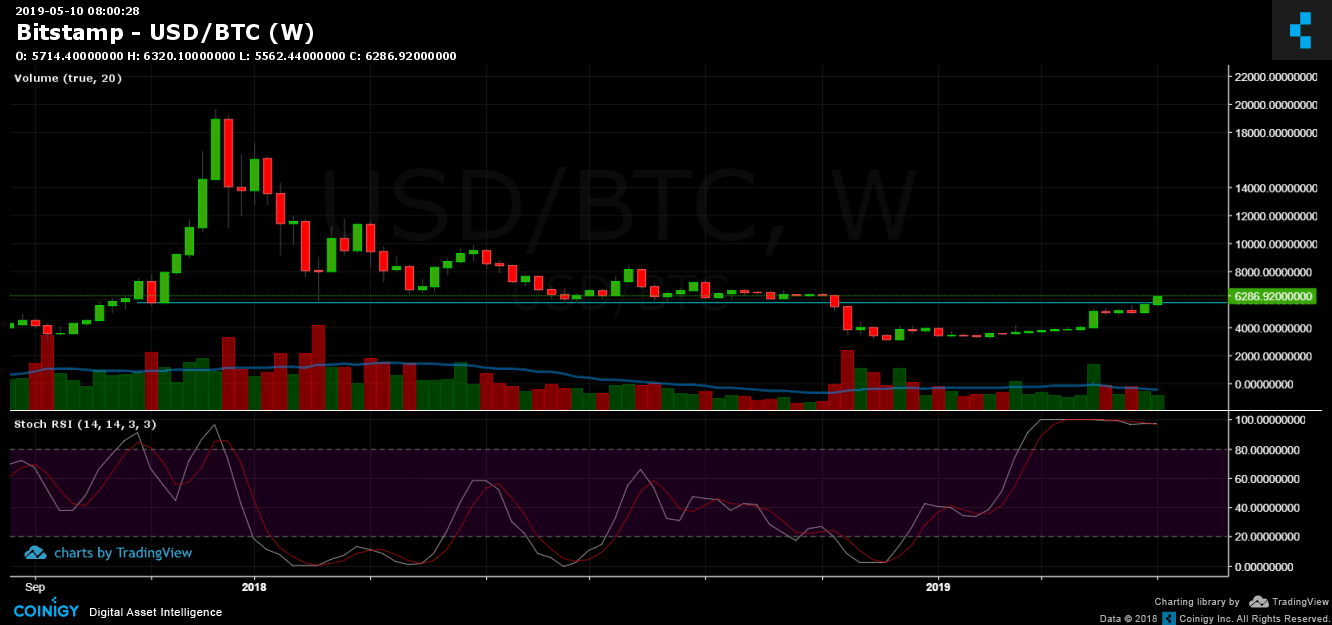
The following is the BTC weekly chart: As you can see, Bitcoin now fully recovered, and it’s back at the levels it was traded for many days of mid-end 2018. Before we dive into support and resistance levels, the chart shows how this current weekly candle is crucial to hold the $6000 mark.

Total Market Cap: $193 Billion
Bitcoin Market Cap: $112 Billion
BTC Dominance: 58%
Looking at the 1-day & 4-hour charts
– Support/Resistance:
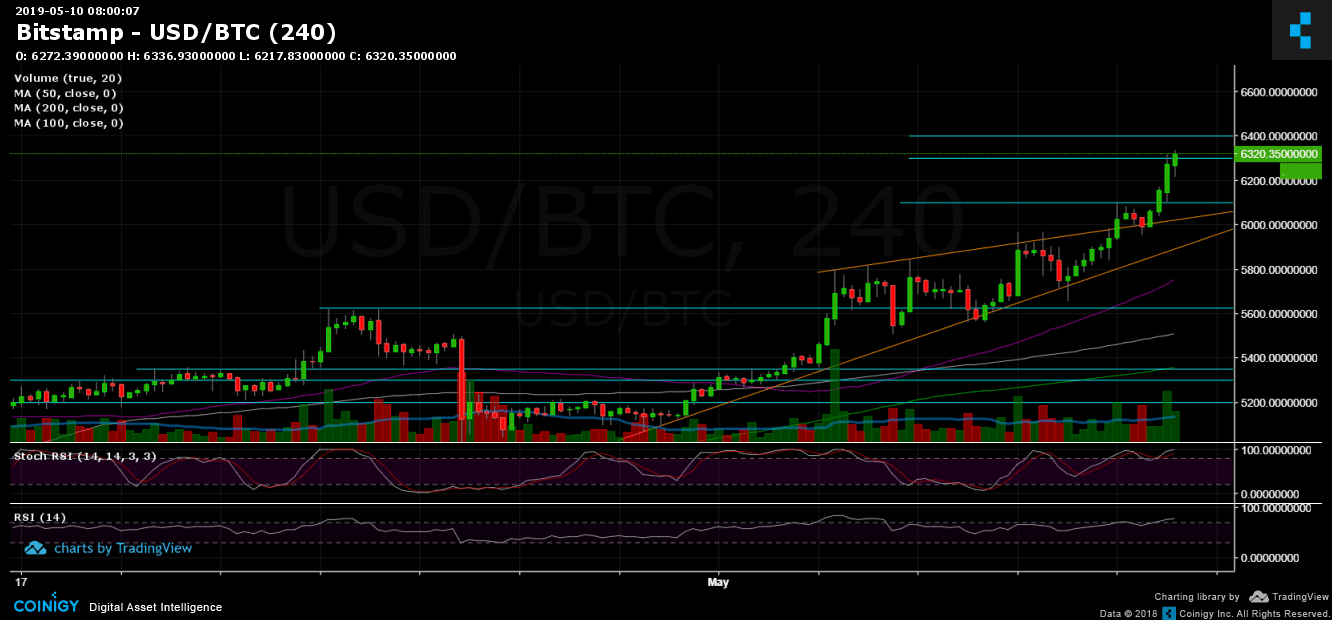
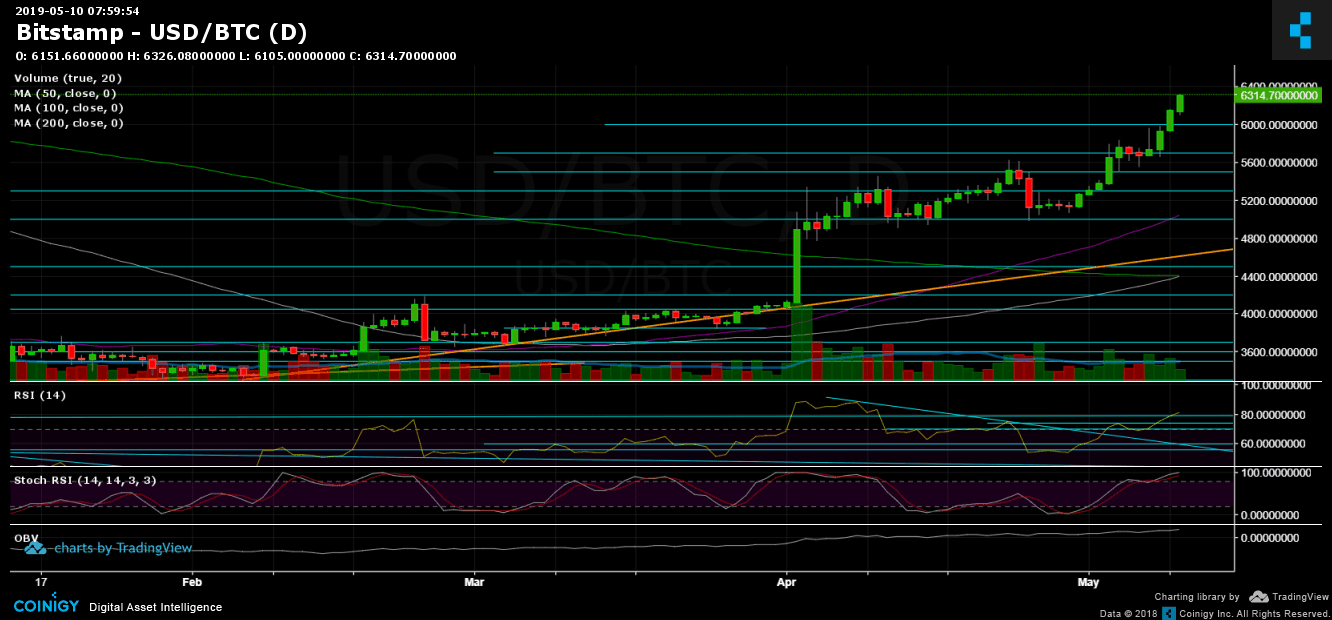
Following the breakout of the $6000 level, Bitcoin continued soaring, breaking up $6100, $6200 and as of now seems to overcome $6300. The next major resistance area is $6300 – $6400. Further above lie the $6600, $6800 and the significant $7000 resistance levels.
However, there was no significant correction since breaking up the $6000, so this possibility will be very healthy for a bullish continuation. As mentioned above, it’s essential to keep up the $6000 on the weekly chart. From below, support levels lie at $6100, $6000, $5700 – $5800 area (strong support) and $5600.
– Trading Volume: As said before, the trading volume of a breakout was expected to be higher than what we actually saw. Another thing to note is that the market cap is slightly increasing; hence, a vast amount of the money is entering Bitcoin is from the crashing Altcoins.
– Daily chart’s RSI: The RSI finally broke above the 74-75 levels and looks very bullish (also invalidated the negative divergence we saw recently on the RSI). However, the RSI is overstretched in the bullish territory so that a correction will come sooner or later.
– BitFinex open short positions: After reaching their 5-day high at 32.7K BTC open short positions, the recent spike had shut some positions, and now the shorts stand around 31.4K, which is still high, compared to the last period.
BTC/USD BitStamp 4-Hour Chart

BTC/USD BitStamp 1-Day Chart

The post Bitcoin Skyrockets To $6300, Over $1K In 7 Days: Price Analysis & Overview May 10 appeared first on CryptoPotato.


