Bitcoin Skyrockets Above $8K – What Can Ruin The Party? BTC Price Analysis & Overview May 13
The past two days since our previous BTC price analysis were probably the best days for Bitcoin during 2019: The coin is just unstoppable.
After breaking up the $7000, the $8000 target we mentioned in our recent weekly price analysis & overview, had reached very quickly. As of writing this, Bitcoin explodes above $8000.
Just a week ago the coin was trading around $5700. Less than two months ago, Bitcoin was trading under $3800. This is crazy, but, this is crypto.
So What can Stop Bitcoin’s current Bull-Run?
Any asset that surges too fast will have to correct and slow down. The longer there is no correction, the deeper the correction will likely be, when it takes place.
Earlier we mentioned that Binance is set to continue its deposits and withdrawals on Tuesday. This can definitely have an impact on the crypto markets. When Binance is out of the game, it’s easier to drive the price.
Besides, reasons like the dropping stock markets, Whole Foods adoption, Bakkt launch on July – are giving the cryptocurrency green light to continue surging.
Total Market Cap: $233 Billion
Bitcoin Market Cap: $140.7 Billion
BTC Dominance: 60.5%
Looking at the 1-day & 4-hour charts
– Support/Resistance:
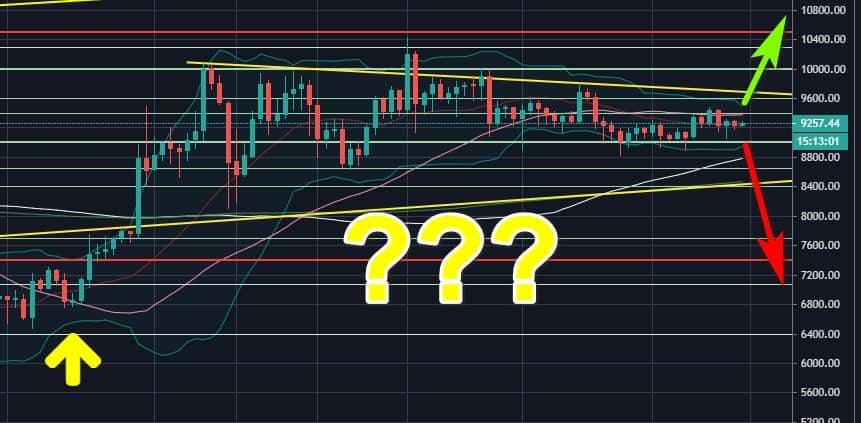
As of now, Bitcoin is trading over $8000. The next major resistance level lies at the $8200 – $8300 area, which is the high reached at the end of July 2018. Further higher resistance lie the $8500 level, $8800 and $9000.
From below, the $8000 has now become the closest support level. Below lie the resistance turned support levels $7800, $7600, $7400 and $7000. Reasonable and healthy correction can even drop back to the $6K area.
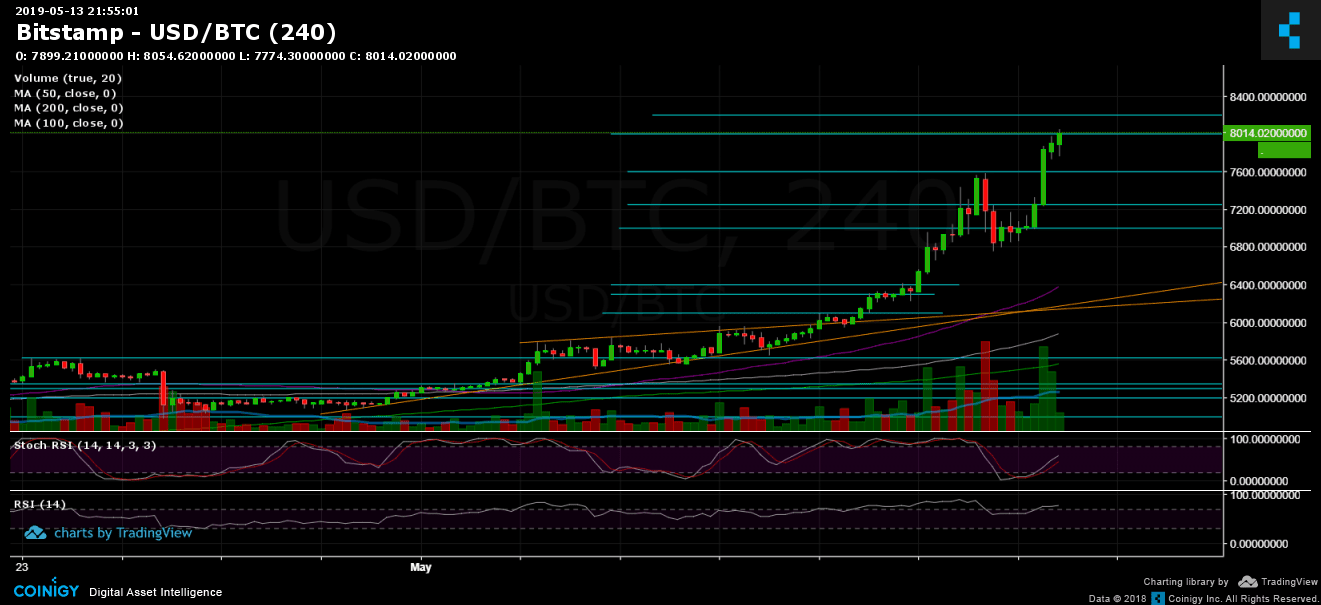
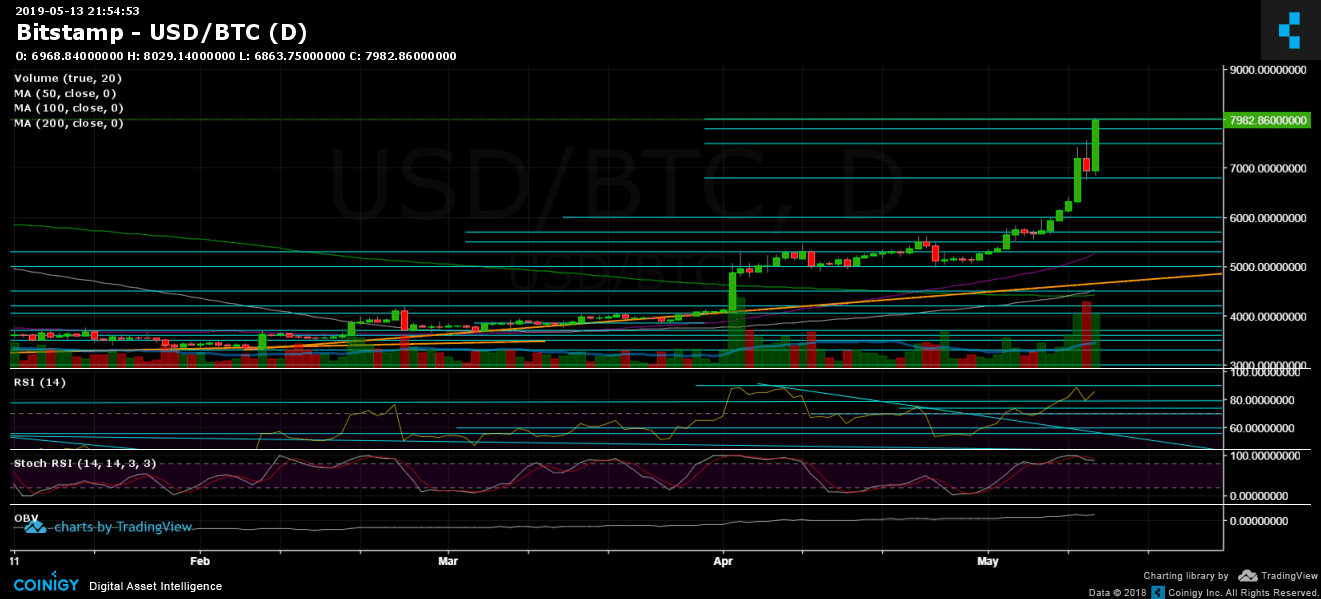
– Trading Volume: Finally we see some green volume! The volume candles of the past two days are looking great. Money is being driven to the market; this can also be said by the daily chart’s OBV indicator.
– Daily chart’s RSI: As mentioned on our previous analysis, Bitcoin is nearing the 88-90 RSI levels. Bitcoin didn’t succeed in breaking the above level after reaching 88 RSI. The RSI found support at 80 and as of now, facing the resistance area mentioned one more time.
– BitFinex open short positions: Over the past days we have seen a short squeeze, as the amount of open short positions stand at 26K after reaching a high of 32.7K BTC open short positions over the past week.
BTC/USD BitStamp 4-Hour Chart
BTC/USD BitStamp 1-Day Chart
The post Bitcoin Skyrockets Above $8K – What Can Ruin The Party? BTC Price Analysis & Overview May 13 appeared first on CryptoPotato.