Bitcoin Sees Lowest Ever Monthly RSI As BTC Dips Below $24K
The cryptocurrency markets are in shambles over the past couple of days, and bitcoin’s price dropped to levels not seen since December 2020. Data shows that the monthly relative strength index (RSI) is at its lowest point… ever.
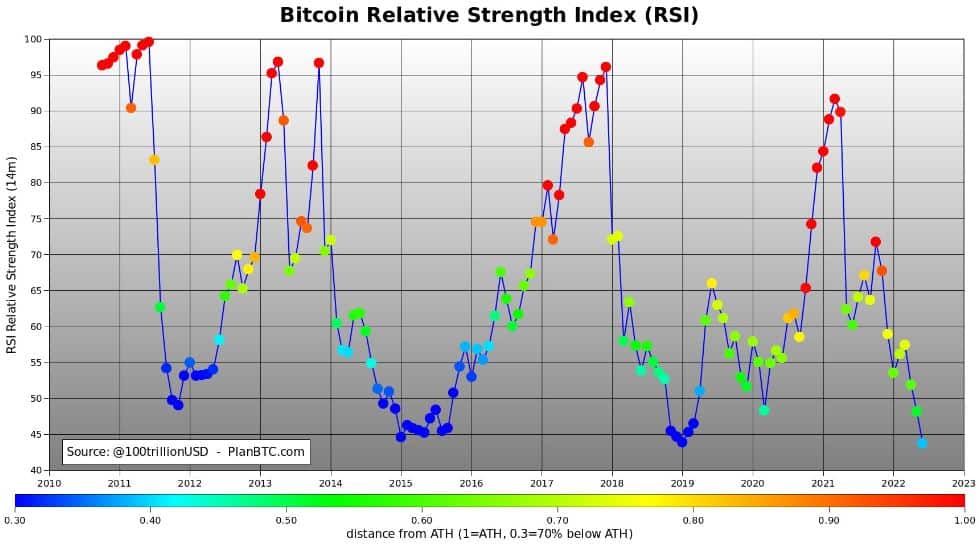
- Popular BTC analyst and creator of the Bitcoin Stock-to-Flow (S2F) model, PlanB, reiterated the current bearish sentiment, outlining that the monthly RSI of BTC is at its lowest point – ever.
- Sitting at 43.7, the last time it was close to being this low was back in January 2019 when BTC was trading at $3400, and the monthly RSI clocked in at 43.9. Before that – the next lowest point was in January 2015, when BTC was trading at $210 and the monthly RSI was at 44.6.

- The Relative Strength Indicator (RSI) is a momentum indicator that gauges the magnitude of recent price changes to analyze overbought or oversold conditions in an asset.
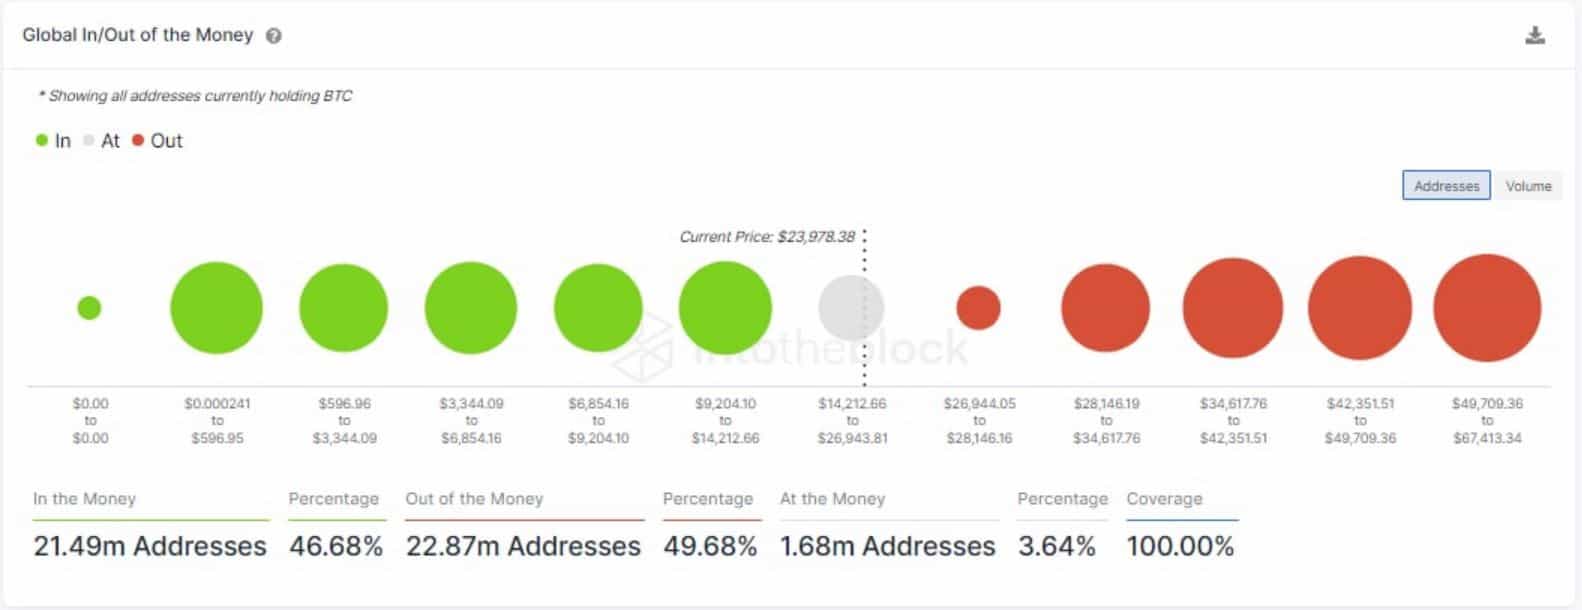
- Another factor to consider following the most recent dip in the bitcoin price is the number of addresses profiting from their BTC positions.
- Data from analytics provider IntoTheBlock reveals that at prices slightly below $24K, only 46.58% of the addresses that hold BTC are in the money.

- That said, the capitalization of the total cryptocurrency market dropped below $1 trillion earlier today as BTC, as long as altcoins, chart multi-month lows.


