Bitcoin Sees Biggest Single-Day Price Gain Since April

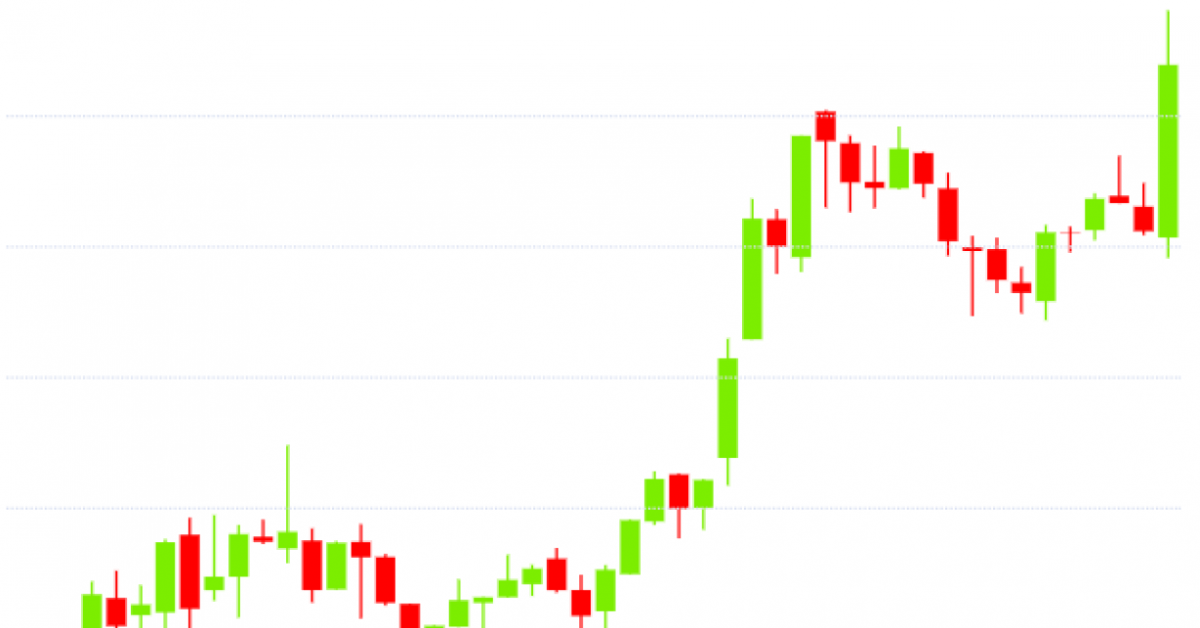
Bitcoin (BTC) is teasing a short-term bullish reversal, having just recorded its biggest single-day gain in seven months.
Prices closed yesterday (UTC) at $4,257, a 24-hour increase of 11.43 percent and the highest daily gain since April 12, according to CoinMarketCap.
Back then, the cryptocurrency was trading above $6,900, 38 percent higher than the current price of $4,345. Interestingly, the 13 percent price gain witnessed that day had been preceded by a 45 percent drop and a minor bout of consolidation.
More importantly, the big bullish move of April 12 marked the beginning of the rally, which saw prices rise to near $10,000 by early May.
Similarly, yesterday’s 11 percent rise had been preceded by a 44 percent drop to 14-month lows below $3,400. Further, positive signs are building up on the short duration technical charts. As a result, bitcoin could be in for a short-term bullish reversal, similar to the one witnessed after April 12.
Daily chart

Yesterday, BTC created a big bullish candle, validating the bearish exhaustion signaled by the previous three long-tailed candles. With the strong move higher, the 14-day relative strength has moved back into undersold territory above 30.00, confirming a bullish divergence (higher low on RSI).
So, it’s possible history is about to repeat itself with a bullish move toward $5,000.
Notably, the bullish case looks stronger than it did seven months ago. The RSI hit record lows during the recent sell-off, signaling extreme oversold conditions, as opposed to readings above 30 registered before April 12.
4-hour chart

Over on the 4-hour chart, the cryptocurrency is probing the falling channel resistance of $4,320 at press time, having confirmed a double bottom breakout with a move above $4,120 earlier today.
Notably, the bull flag breakout seen in the 15-minute chart is signaling that the falling channel hurdle could be breached in the next few hours. The breakout, if confirmed, would only bolster the already bullish technical setup.
View
- BTC’s 11 percent price gain has likely turned the tables in favor of the bulls.
- A falling channel breakout on the 4-hour chart, if confirmed, would open the doors for a test of psychological resistance at $5,000.
- The short-term bullish case would weaken if a convincing break above the 10-day exponential moving average (EMA), currently at $4,293, remains elusive for the next 48 hours.
Disclosure: The author holds no cryptocurrency assets at the time of writing.
Bitcoin image via CoinDesk archives; charts by Trading View


