Bitcoin Returns to $29K After Failing at $30K, Shiba Inu Pumps 16% in 7 Days: This Week’s Crypto Recap
After several weeks of sideways trading and failing to register any significant price movements in either direction, these past seven days provided more volatility that resulted in both multi-day lows and highs for BTC.
It all started on Monday when the primary cryptocurrency dumped by several hundred dollars after the quiet weekend to a weekly low of $28,700. However, the bulls intercepted the move and pushed the asset north. In fact, what followed was among the most notable leg-ups registered in the past few months, as bitcoin shot up to over $30,000 by Wednesday.
This became its highest price tag since July 23. The asset tried to remain above $30,000 but failed by the end of the day and the subsequent rejection pushed it back south to its current price tag of around $29,500. Interestingly, even the CPI numbers that came out earlier this week didn’t result in enhanced volatility, which used to be the case up until a few months ago.
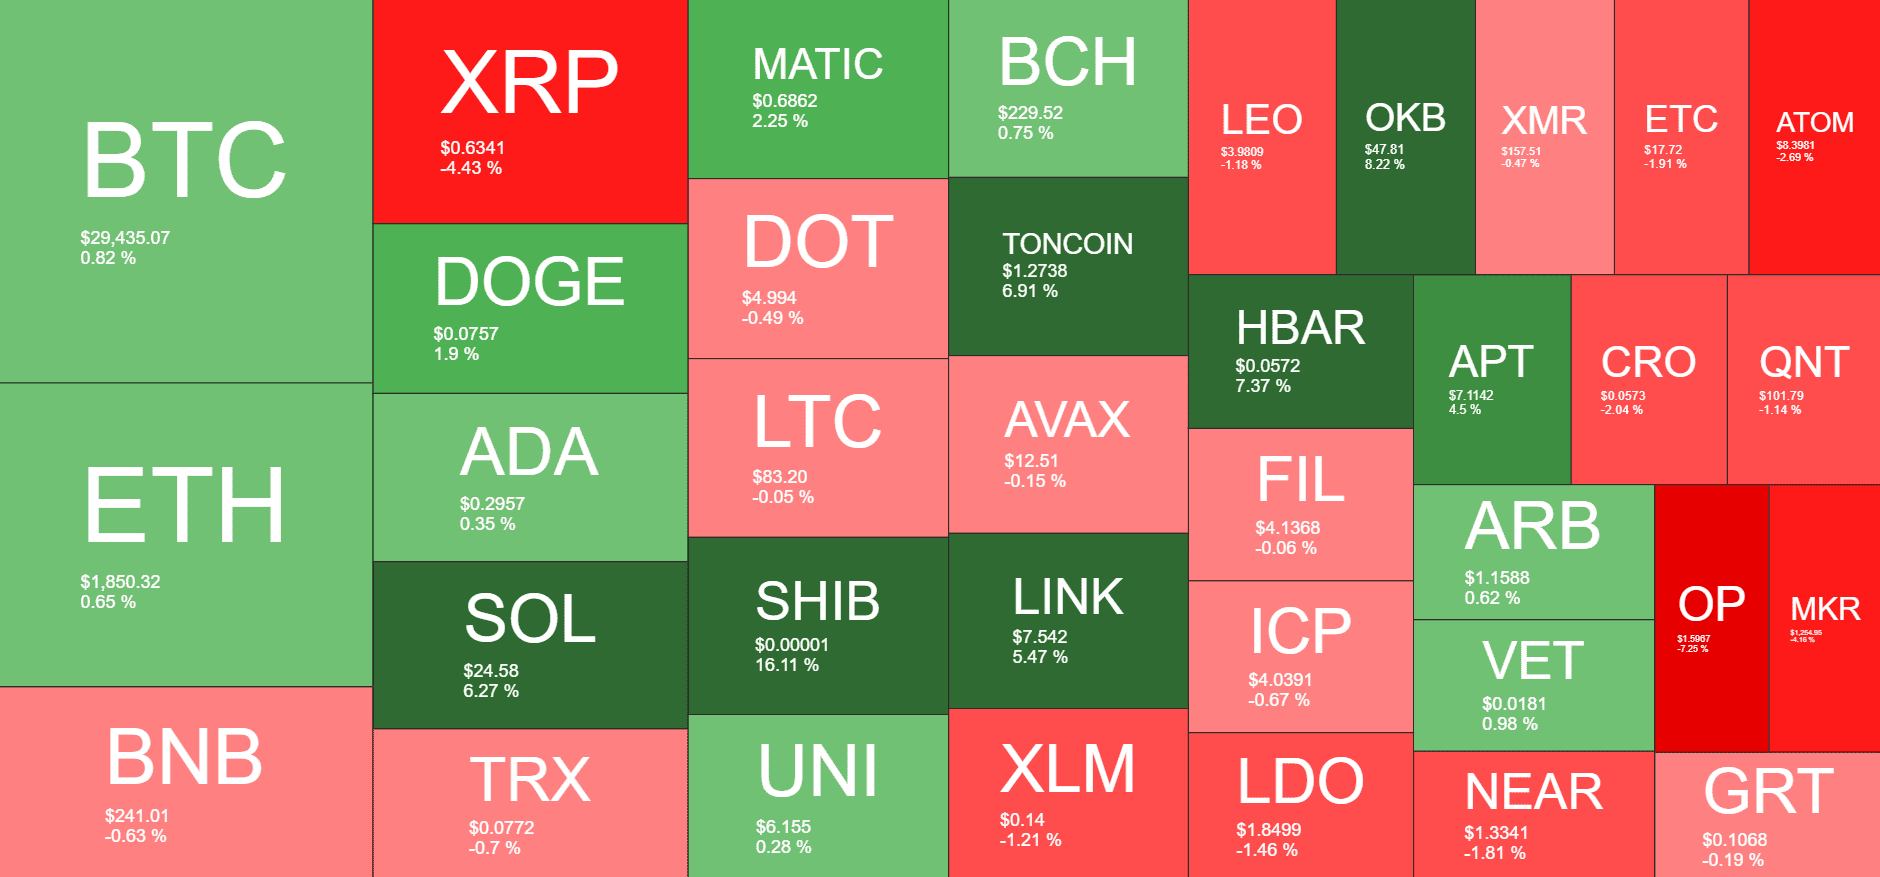
Some altcoins, though, have performed a lot better than BTC for the same 7-day period. Such is the case with Solana, Chainlink, TONCOIN, HBAR, and OKB. All of these have surged by somewhere between 6 and 9% on a weekly scale.
Nevertheless, Shiba Inu has taken the main stage from the larger-cap alts. SHIB has soared by more than 16% since last Friday and trades above $0.00001.
Rollbit Coin has emerged as the top performer within the same timeframe, having added over 76% of value. This has helped RLB find a place within the top 100 largest digital assets by market cap.
Market Data
Market Cap: $1,218B | 24H Vol: $29B | BTC Dominance: 47%
BTC: $29,435 (+0.7%) | ETH: $1,850 (+0.4%) | BNB: $240 (-0.7%)
This Week’s Crypto Headlines You Can’t Miss
Here’s How Much of ETH’s Total Supply is Held in the Top 10 Addresses. It turns out that ETH’s supply held by the 10 largest wallets has been increasing considerably since 2018. In fact, it increased by a whopping 27% throughout the period.
Is Tether Really the 11th Biggest Bitcoin Holder? CryptoQuant Chips In. Recently, analysts were suggesting that Tether is the 11th biggest Bitcoin holder. However, the prominent data analytics firm CryptoQuant took it to Twitter to question these statements and provide additional clarifications.
Ripple (XRP) Lead Lawyer Slams SEC’s Appeal Request, Reveals Important Date. Stuart Alderoty – the Chief Legal Officer at Ripple Labs – slammed SEC’s appeal attempt and also revealed a timeline as to when users can expect the company to take action against the most recent filings.
The US SEC Might Approve Numerous Spot BTC ETFs at the Same Time, Cathie Wood Thinks. According to Cathie Wood, the United States Securities and Exchange Commission might approve a number of spot Bitcoin ETFs at the same time. Wood is exposed to the market through a number of investments.
El Salvador Becomes the Latest Country Where Binance Secures Regulatory Approval. El Salvador – the Bitcoin-friendly nation – became the latest country to approve and provide regulatory approval for the world’s leading cryptocurrency exchange – Binance.
Federal Reserve Launches New Program to Oversee Crypto Activities of Banks. The US Federal Reserve is launching a new program. It aims to help the institution oversee various cryptocurrency activities that banks carry out.
The post Bitcoin Returns to $29K After Failing at $30K, Shiba Inu Pumps 16% in 7 Days: This Week’s Crypto Recap appeared first on CryptoPotato.


