Bitcoin Recovers From $900 Crash After Another $12K Rejection (BTC Price Analysis)
Bitcoin bulls were met with another wave of intense selling pressure at the psychological $12,000 yesterday, which sent prices reeling $900 all the way back to the $11,160 level.
This is the third time in under a month that BTC has experienced a strong rejection at this critical level of around $11,100.
In the previous analysis from yesterday, we anticipated that Bitcoin breaking into the overbought region on the 4-Hour RSI would create some intense selling pressure against the uptrend. This was likely one of the main catalysts for initiating the trend reversal.
According to Datamish, over $58.3 million worth of BitMEX longs were also liquidated during the crash. This significant squeeze will have almost certainly assisted in driving Bitcoin’s price down further once the breakdown began.
So far, $25 billion has departed from the crypto market in the last 24 hours, as panic and fear take hold of traders once again.
Price Levels to Watch in the Short-term
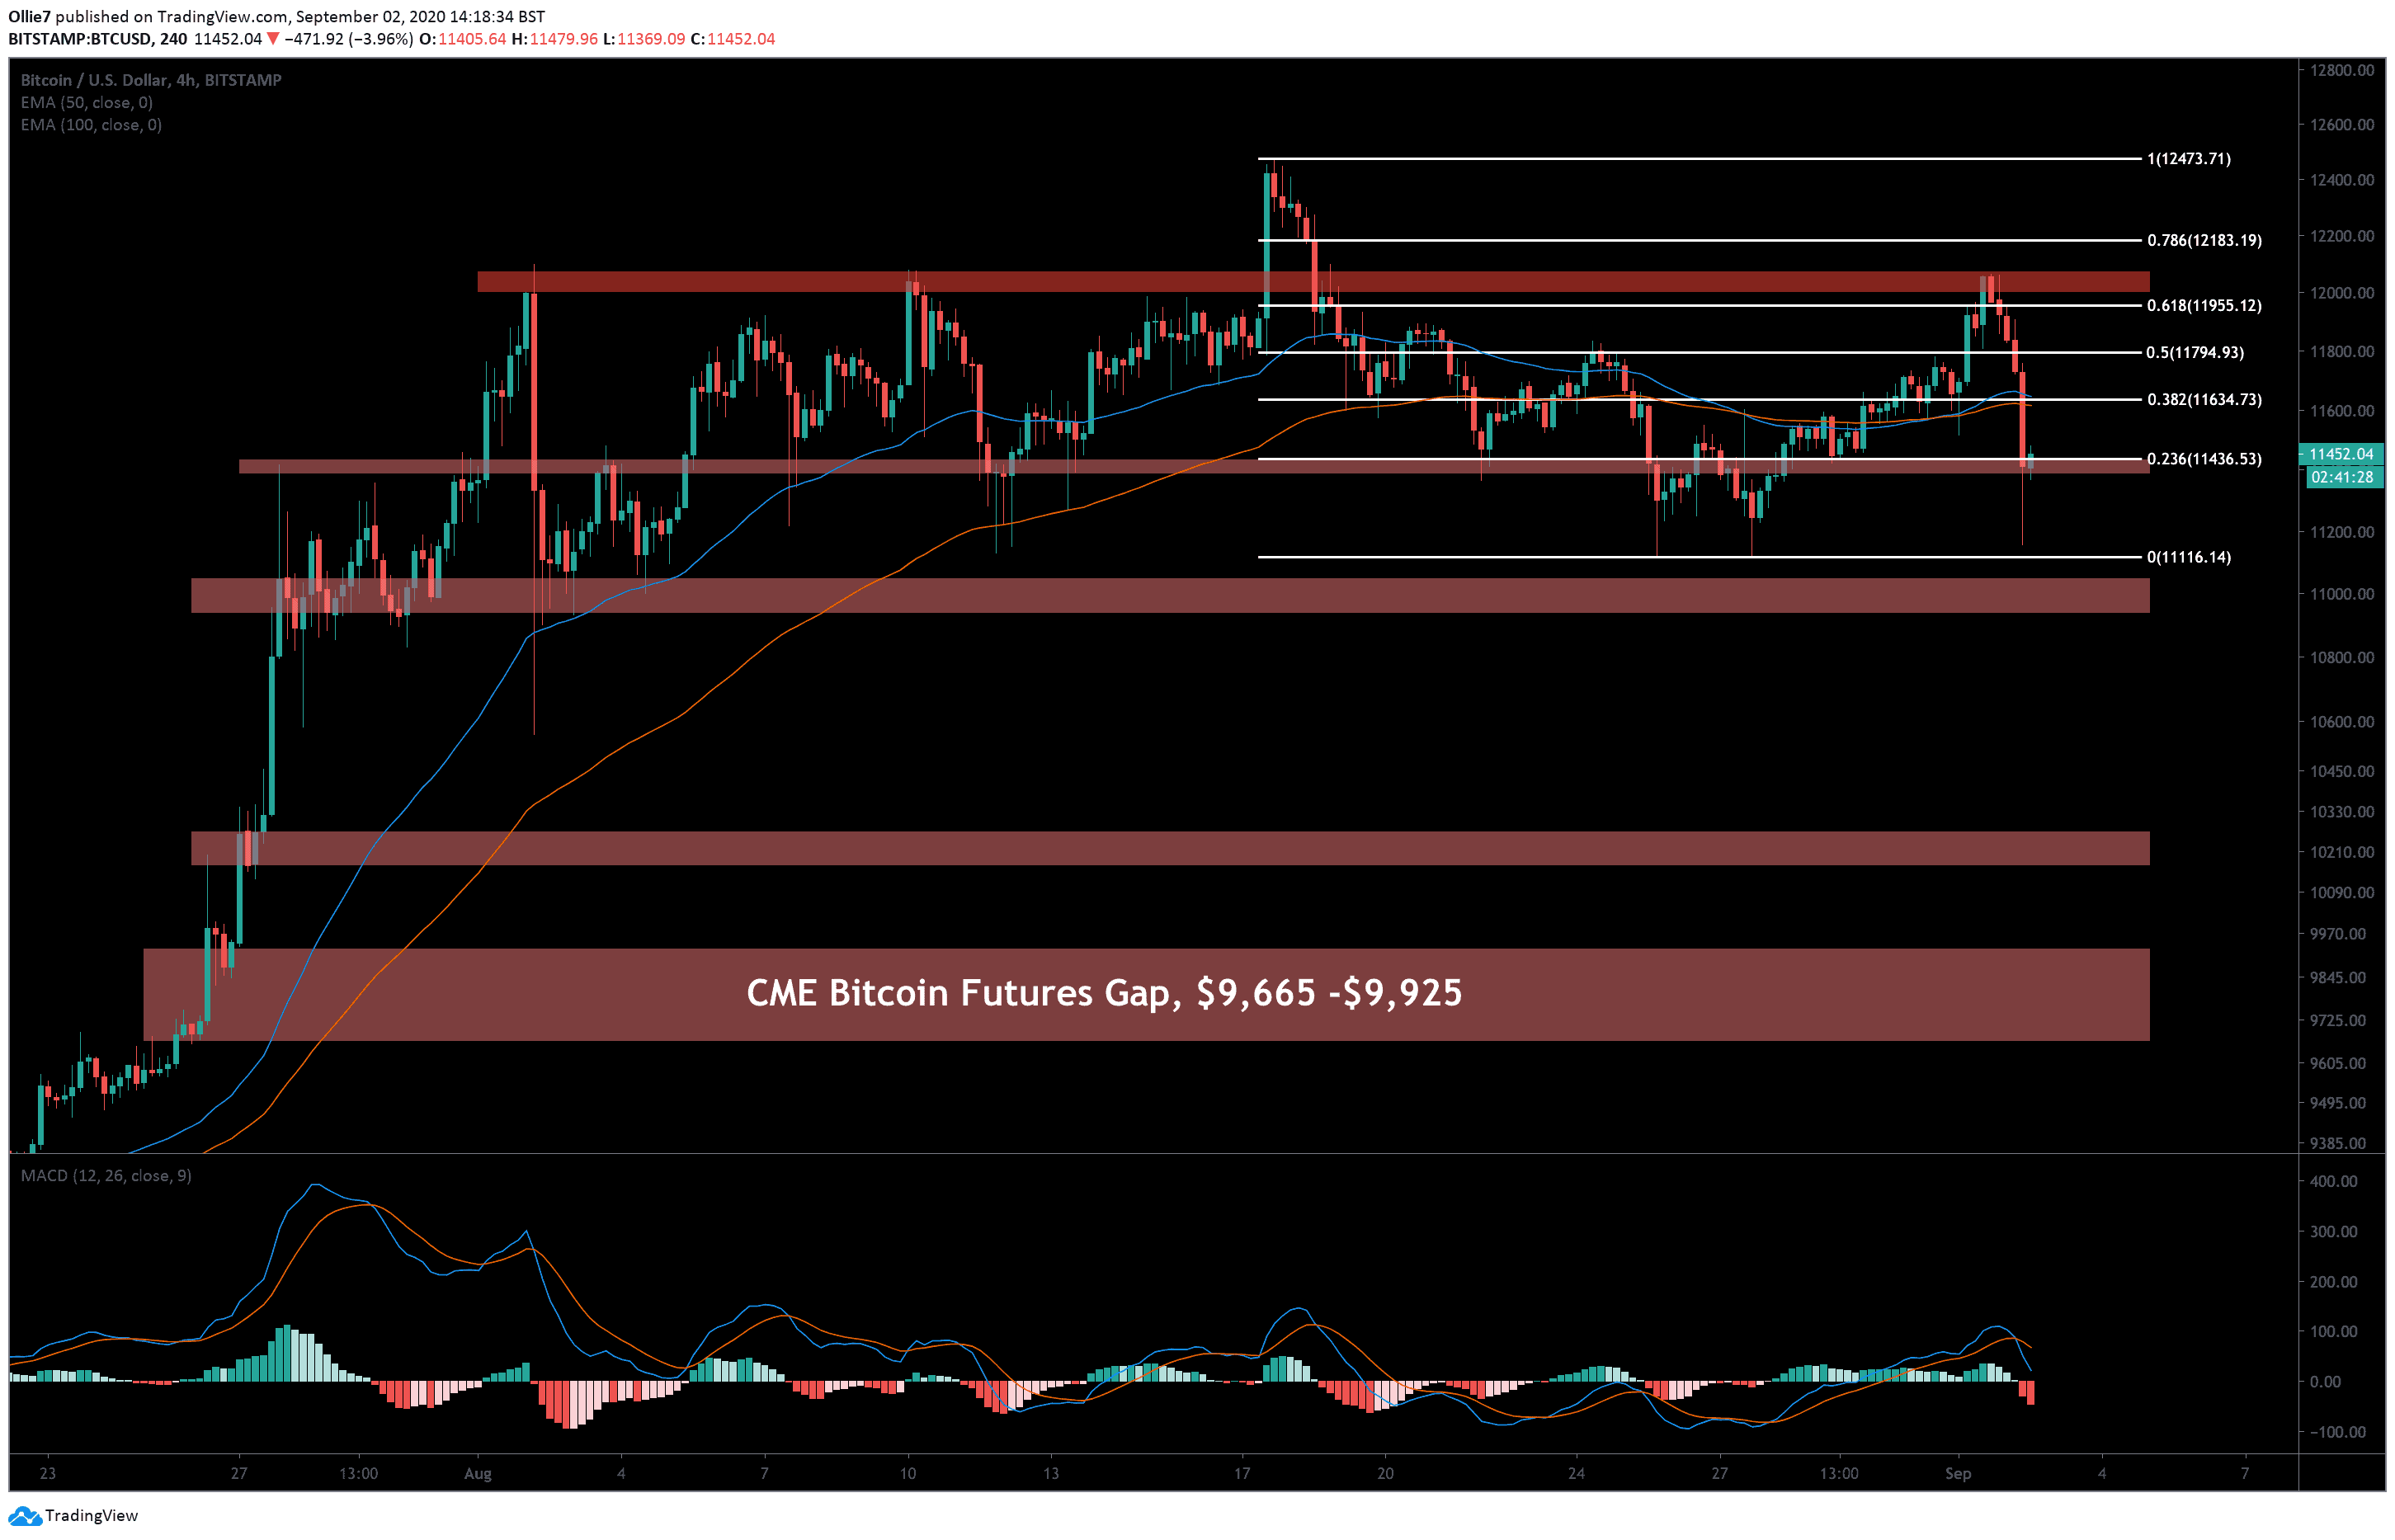
On the 4-Hour BTC/USD chart, we can see that the price has managed to return to the safety of the $11,400 support zone (first green area), where it is now consolidating.
Running parallel along the top of this support zone is the 0.236 Fibonacci level ($11,436), which will likely act as the first resistance against any intraday recovery.
Above that, we will likely see the next significant resistance around the critical $11,600 area / 0.382 Fibonacci level. On the 1-Hour chart, it’s clear that the final leg – which saw the leading crypto tank an additional $430 – occurred just as BTC fell beneath this vital point.
This zone is also reinforced by the 50 and 100 EMA lines right now (blue and red, respectively), which should make it even harder to overcome.
Looking below, we should expect to see additional support along with the $11,100 and psychological $11,000 levels, if panic continues to drive prices lower. Once again, the unfilled CME gap way down at the $9,925 level is looking like a potential target if Bitcoin takes another sudden dive.
After strong reactions like this, however, it’s more common to see the price action push sideways as traders wait for more certainty.
Total market capital: $383 billion
Bitcoin market capital: $211 billion
Bitcoin dominance: 55.0%
Data by Coingecko*
Bitstamp BTC/USD 4-Hour Chart

The post Bitcoin Recovers From $900 Crash After Another $12K Rejection (BTC Price Analysis) appeared first on CryptoPotato.


