Bitcoin Reclaims the Crucial 200-MA: Is $50K Incoming? (BTC Price Analysis)
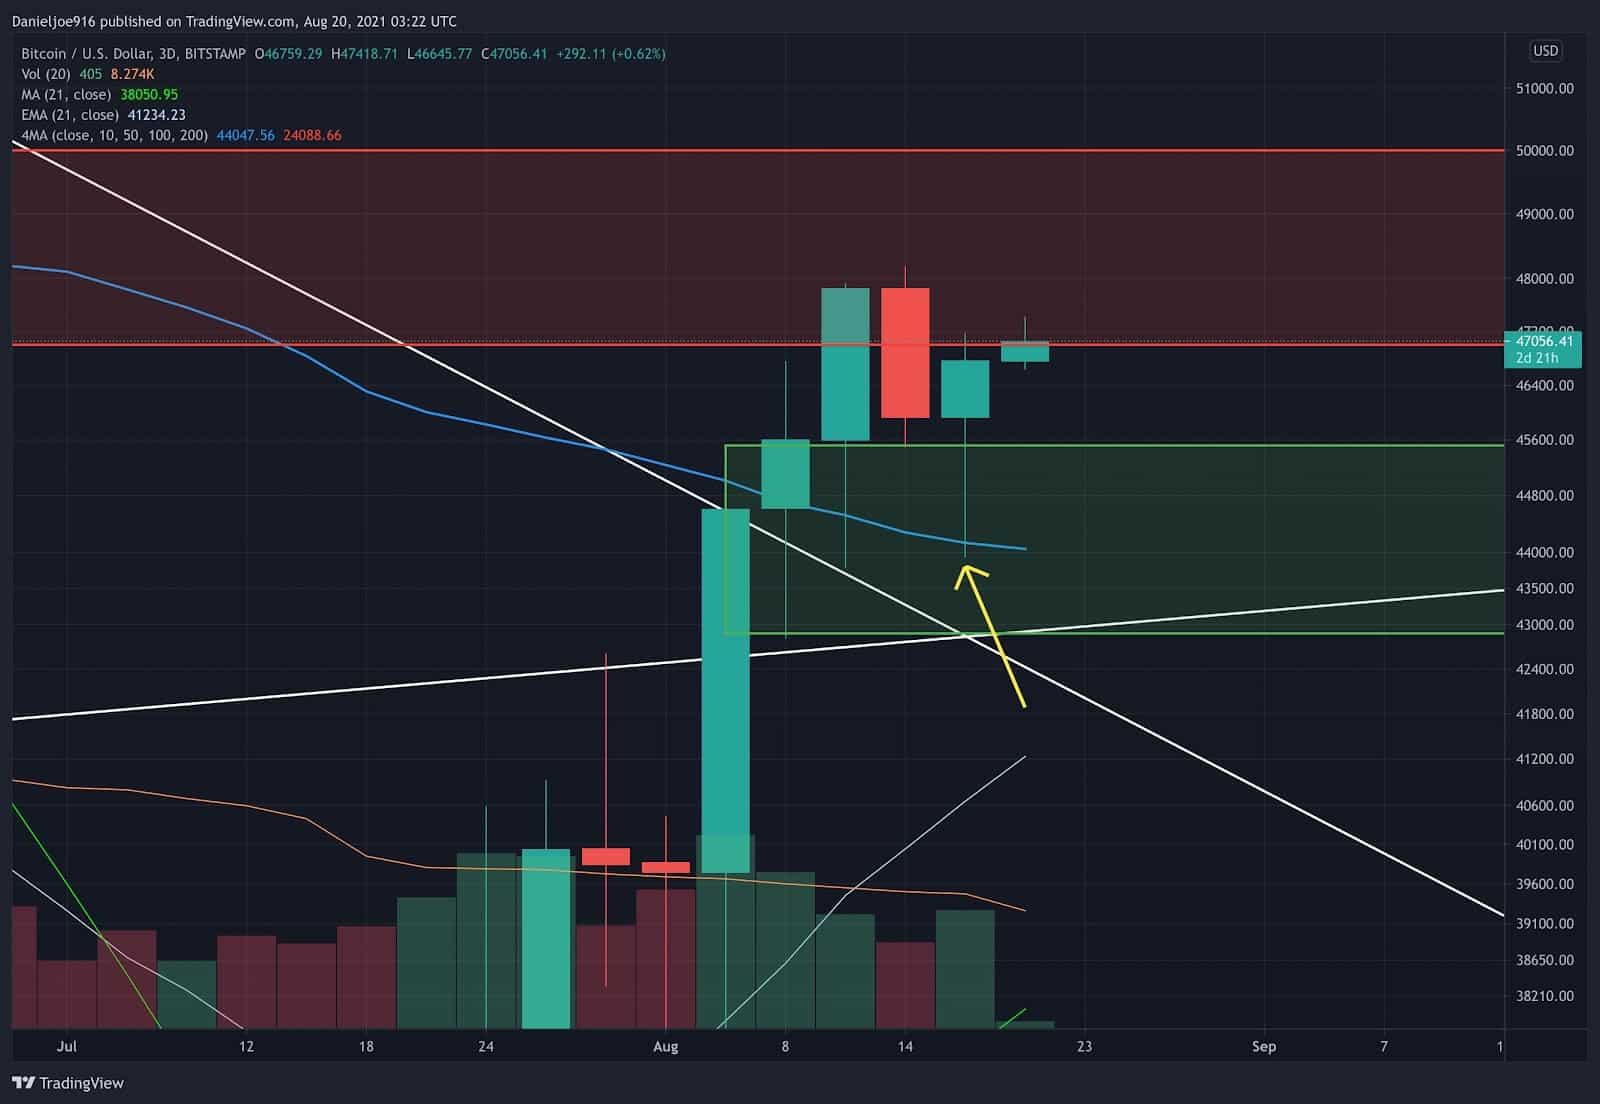
BTC has been showing significant signs of strength after reclaiming the critical 200-day moving average, even with SPX futures diving on Thursday morning. The SPX recovered throughout the day, with BTC continuing to outperform, closing higher by 4.6% at $46.7k.
The five-day-long pullback had less aggregate volume than the 14-day average, indicating less selling pressure. So far, BTC’s 64% rally from the bottom at $29.3k had a higher aggregate volume on “up days” than “down days.” This signals strength in the rallies, with weakening selling pressure during pullbacks.
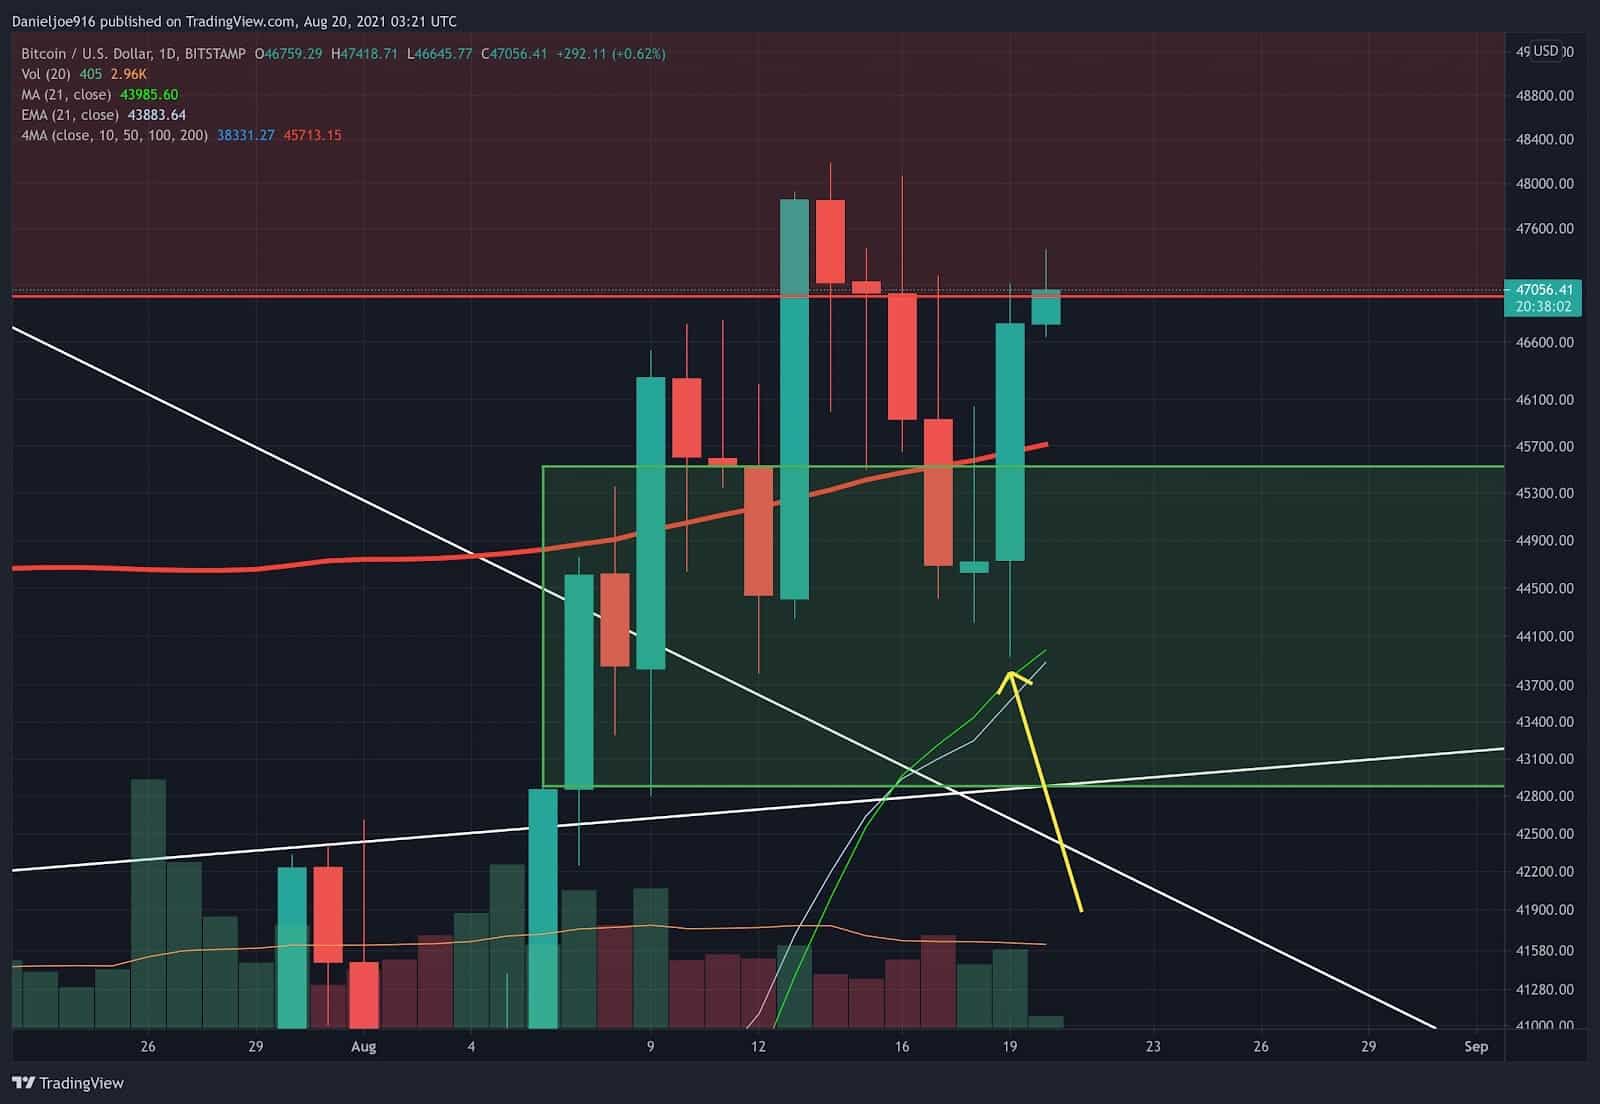
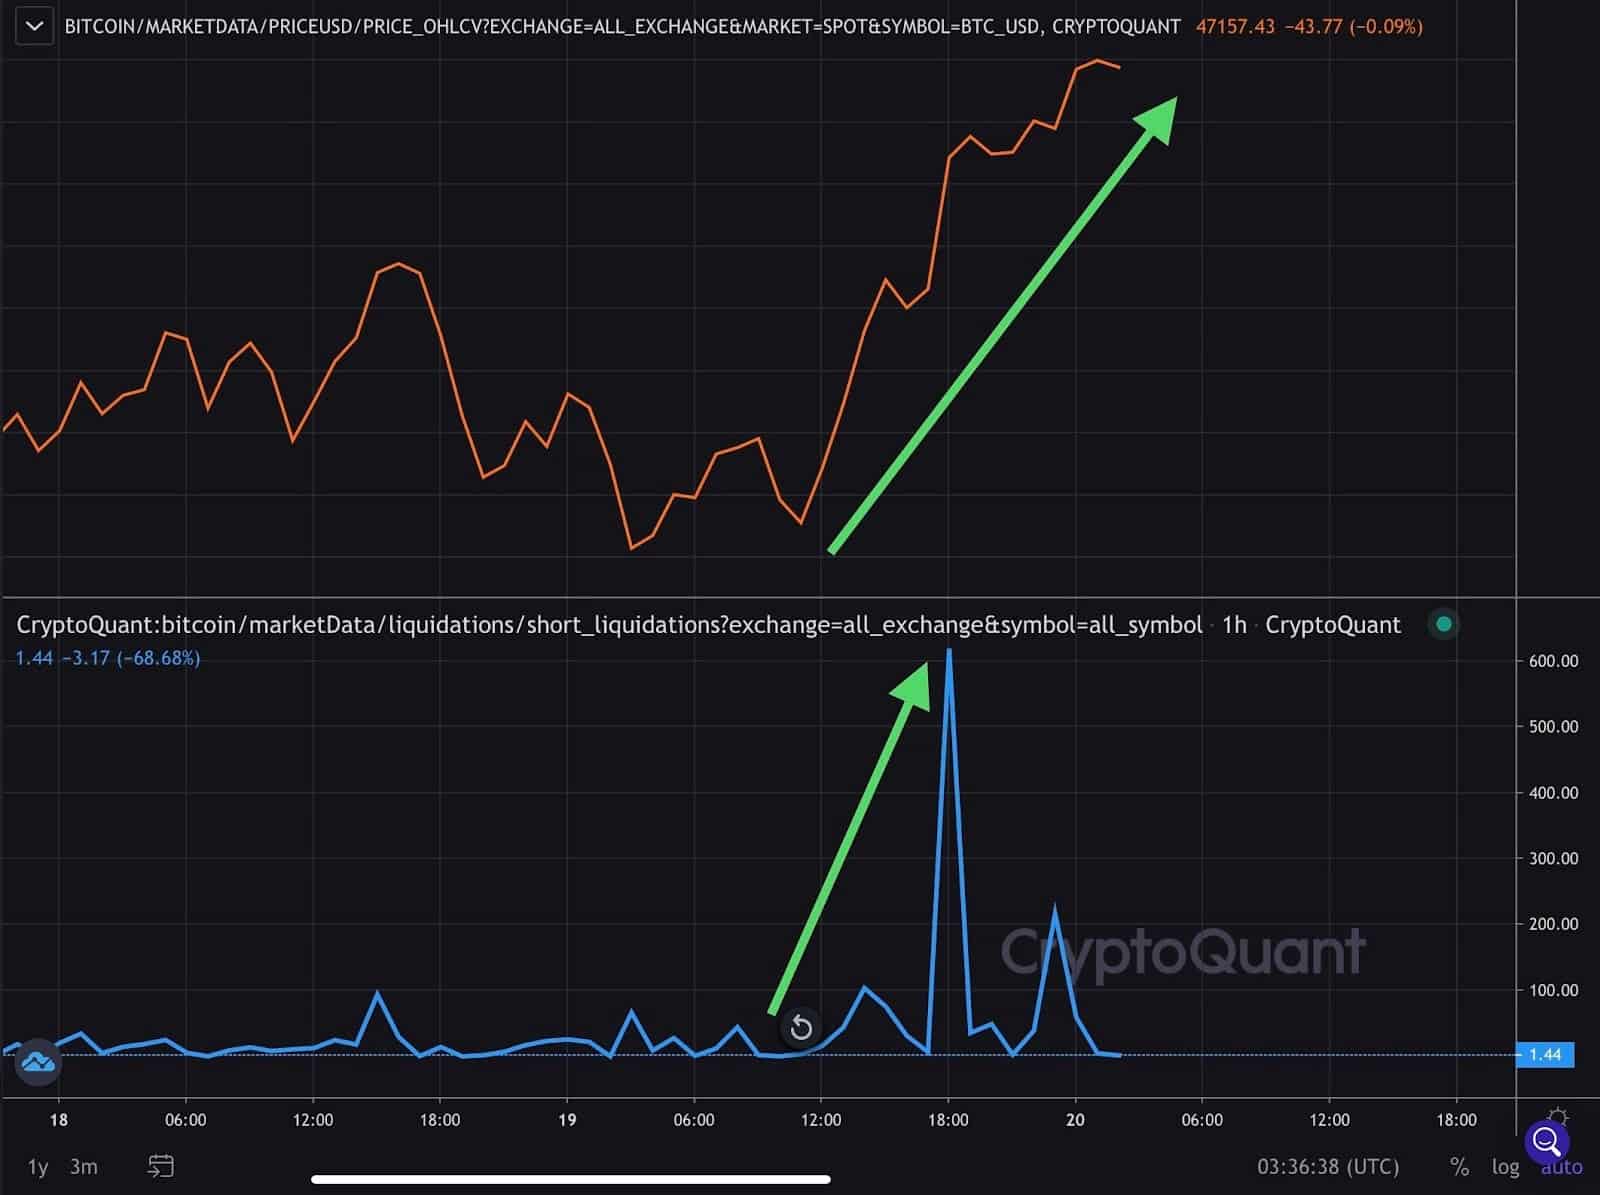
The recent decline managed to mark a local bottom at $43.9k, near the 21-day moving average, an area confluent with many other near-term technical support levels. After forming the local bottom, BTC pushed higher, liquidating up to 600 BTC shorts in 1 hour.
A near-term catalyst likely helping BTC’s move higher is Coinbase’s announcement of investing up to $500 million into cryptocurrencies along with 10% of their profit going forward.
3-day Momentum Trending Higher
Yesterday’s daily and 3-day close near the highs printed another bullish pulse – a sign of improving momentum on the mid-time frame chart. The 3-day momentum is getting closer to flashing the next major buy signal if BTC can push higher for the next 3-day candle close.
It’s important to note, buy signals that flash on mid to higher time frame charts signal further upside in the coming weeks to months – not always an immediate spike.
Wyckoff Accumulation Following Structure
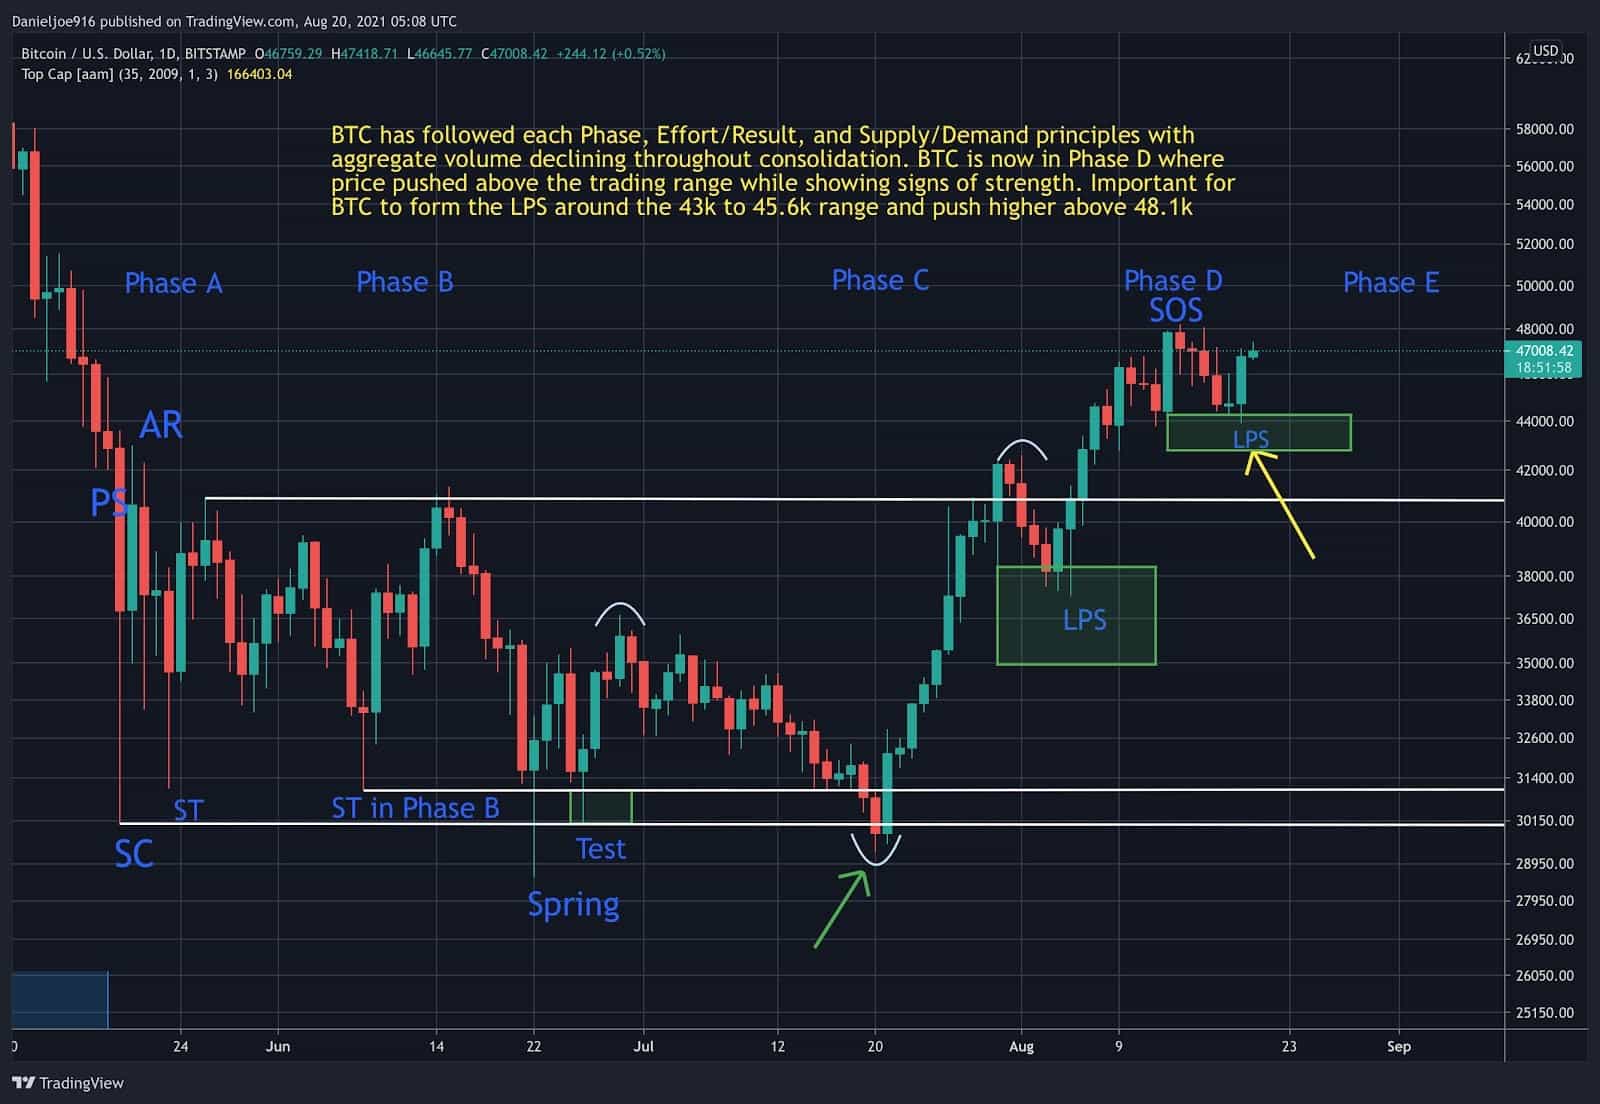
BTC continues in Phase D on the Wyckoff Accumulation after breaking out of the trading range between $30k to $40k. It has closely followed each phase in Wyckoff Accumulation, Effort/Result, and Supply/Demand principles, which led to supply exhaustion and a powerful rally to the upside. As long as BTC can hold the near-term low at $43.9 k, form the last point of support, and complete Phase D, we can expect a rally to the upside as it enters Phase E.
Spot exchange net flows registered an outflow of 1244 BTC during the 5-day pullback even within a risk-off environment. On-chain metrics tracking BTC miners continued to show no major signs of selling as reserves remained flat at 1.85 million BTC.
As previously reported, BTC appears to be following the ideal scenario where price pulls back during the week, finds a local bottom, then pushes higher in the second half of the week, aiming to make a weekly close higher to further validate the largest technical buy signal to flash since April 2020.
From now until the weekly close, the bulls need BTC to hold the 200-day as support and continue pushing higher into the 47k to 50k zone, which has a moderate supply of UTXO realized price distribution. Ideally, spot buying pressure needs to absorb any incoming supply on the market. Once supply in this zone is exhausted, we can expect a push above $50k, likely sending BTC towards the next major zone between $51.1k and $57.1k.
Overall, the near-term push back above the 200-day is a positive signal for BTC bulls. It remains to be seen if BTC can hold the 200-day until the weekly close. With strengthening fundamentals, improving technical momentum, and bullish on-chain signals, the conditions are starting to look favorable for a push to $50k soon.


