Bitcoin Price ‘Throwback’ Suggests Potential For Rally to $37K: Valkyrie Investments
A price pattern called “throwback” has emerged on bitcoin’s daily chart that could recharge bulls’ engines for a rally toward $37,000, according to Valkyrie Investments.
In technical analysis, a throwback is a price drop to a former breakout level or resistance-turned-support. After a breakout, prices rally for some days before losing upward momentum and returning to the breakout point. More often than not, prices surge after the throwback is completed, as Thomas Bulkowski detailed in his book “Visual Guide to Chart Patterns.”
Bitcoin recently fell to around $25,000, revisiting a former inverse head-and-shoulders (H&S) neckline resistance that was breached and flipped into support in March. The 19% pullback from the mid-April high of $31,000 to a former breakout point is a classic throwback pattern, according to Joshua Olszewicz, head of research at Valkyrie Investments.
“Typically, but not always, prices will break above the neckline [resistance] and then return to that level, currently between $24,000 [and] $25,000,” Olszewicz said in a weekly market update. “This behavior is described as a ‘throwback,’ which in this case also includes a nearly three-month bullish reversal falling wedge chart pattern.”
“Positive resolution of the throwback measures as potentially a pivot-to-pivot trade setup from $25,000 to $37,000,” Olszewicz suggested.
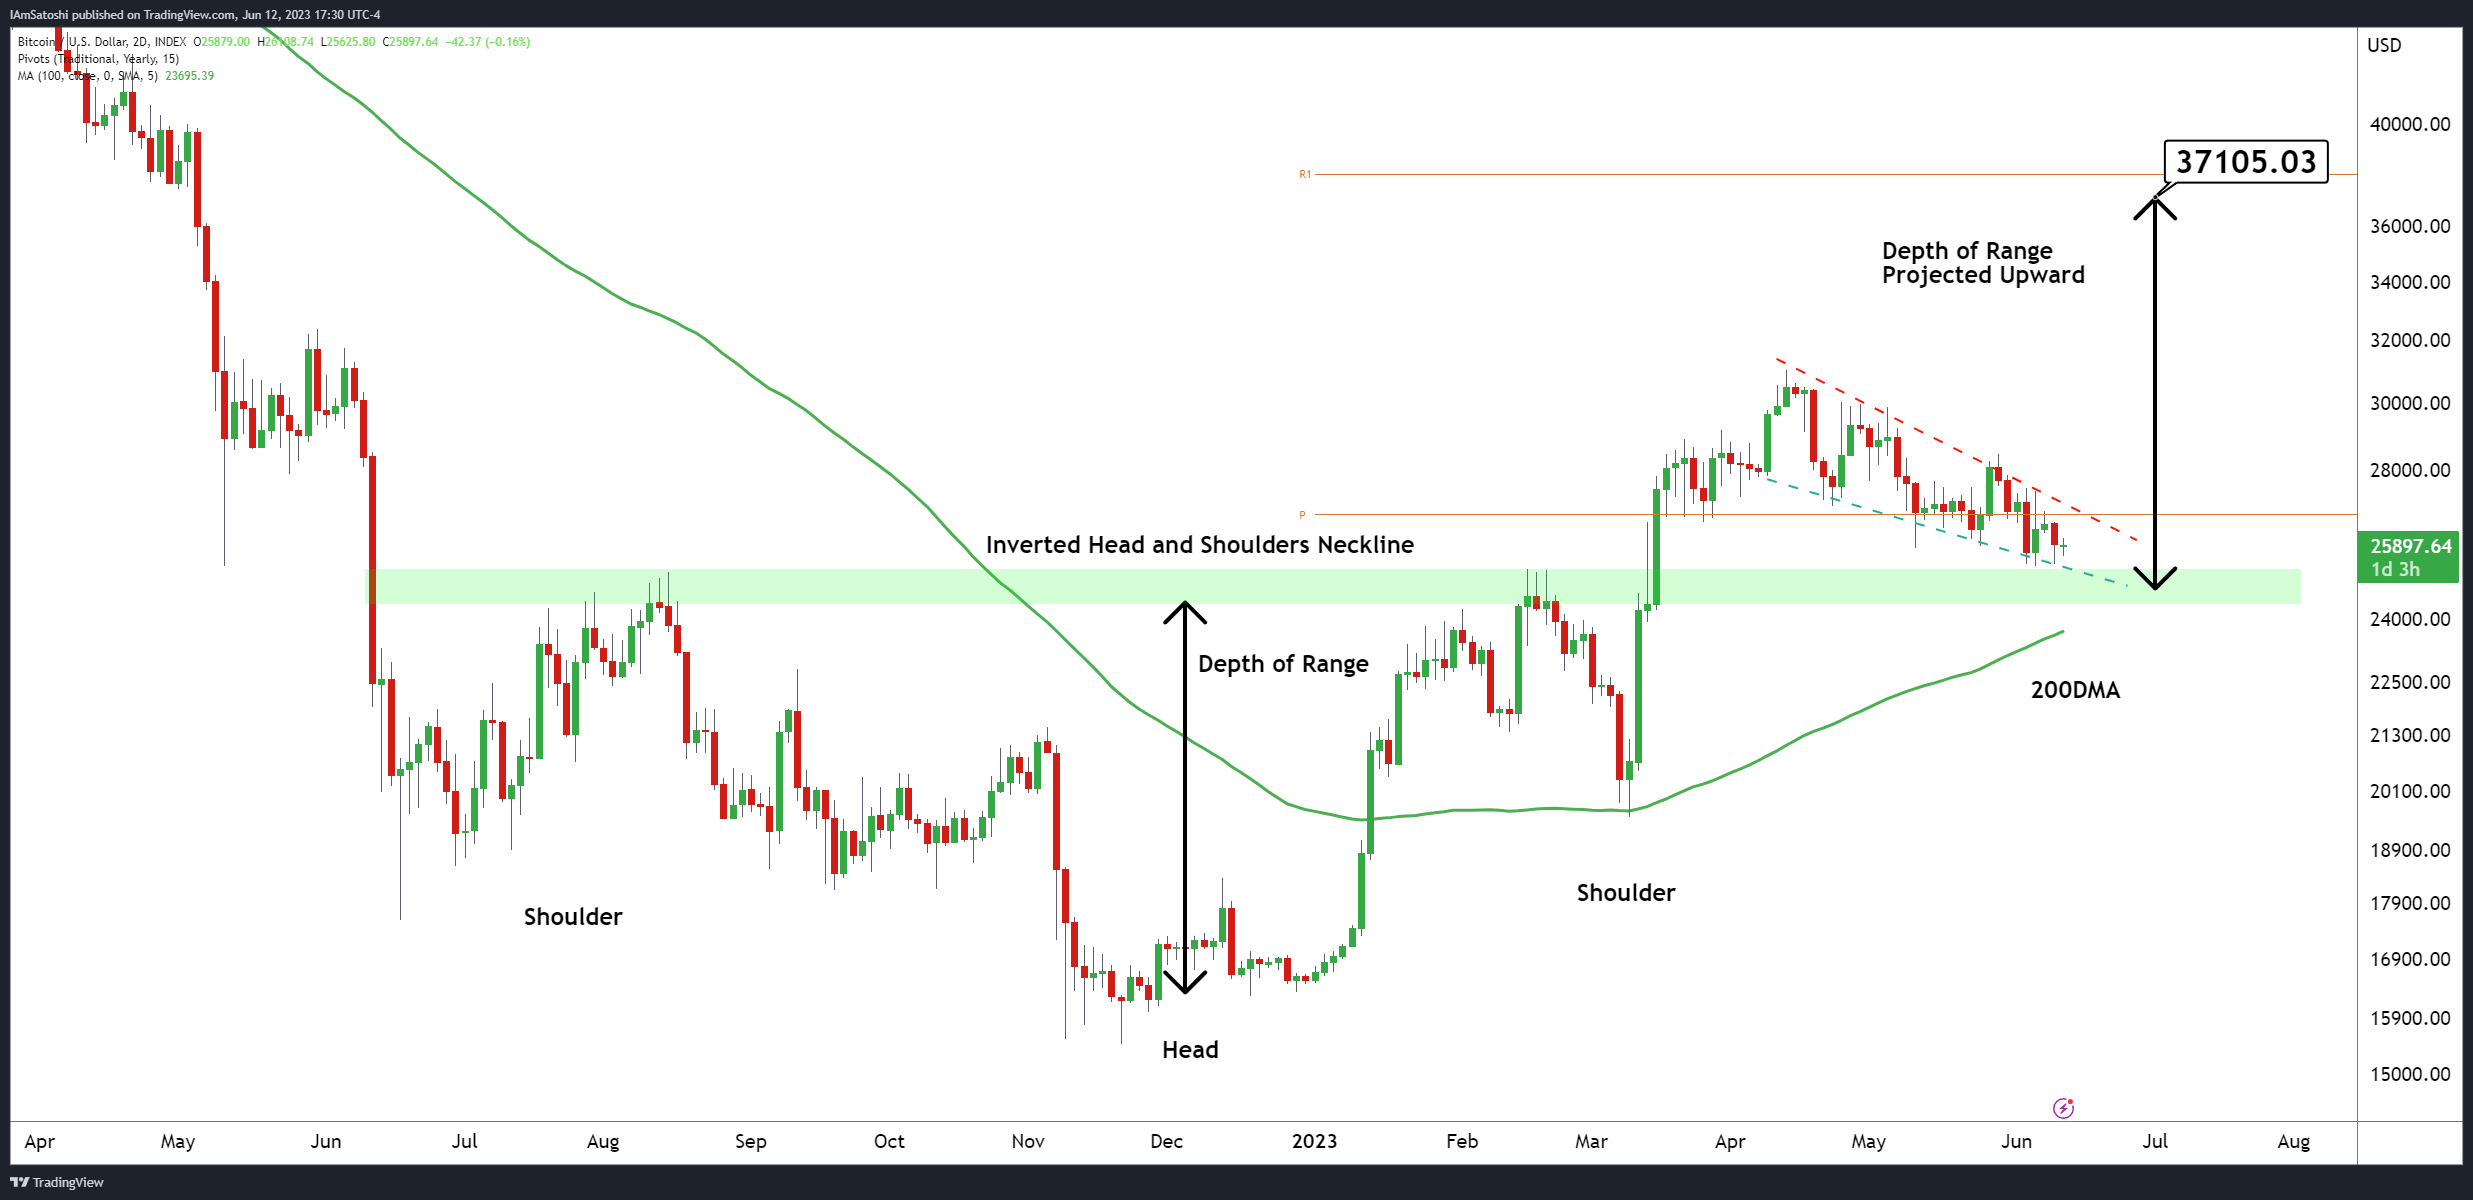
The chart shows bitcoin recently re-testing the green support zone, completing the throwback. Some technical analysis textbooks say throwbacks take ten days at most, although the time limit is often treated as arbitrary.
The throwback has taken the shape of a falling wedge, a pattern characterized by descending converging trendlines. A falling wedge is also a bullish reversal pattern.
The throwback and the wedge will be invalidated if prices drop to the 200-day simple moving average (SMA) at $23,690, per Olszewicz.
“Extended price activity below the 200DMA would suggest a chart pattern failure and further range bound activity between $15,000 to $25,000,” Olszewicz noted.
Edited by Stephen Alpher.