Bitcoin Price Sets New High Above $16,100 – Is Macro Cycle Confirmed? (BTC Analysis)
Bitcoin bulls have returned with force today and propelled the top crypto to a new high of $16,177 – a price not seen since 2017! The global crypto market briefly rose back above $460 billion during the surge as $12 billion flooded back into the space.
Despite strong selling pressure at this new level, optimism is high from other industry-leading traders that Bitcoin has officially entered a new macro-cycle. According to the creator of the popular Bitcoin Stock-to-Flow model, PlanB, this latest pump above the $16,000 threshold means BTC is still on track to reach $100,000 per coin.
Price Levels to Watch in the Short-term
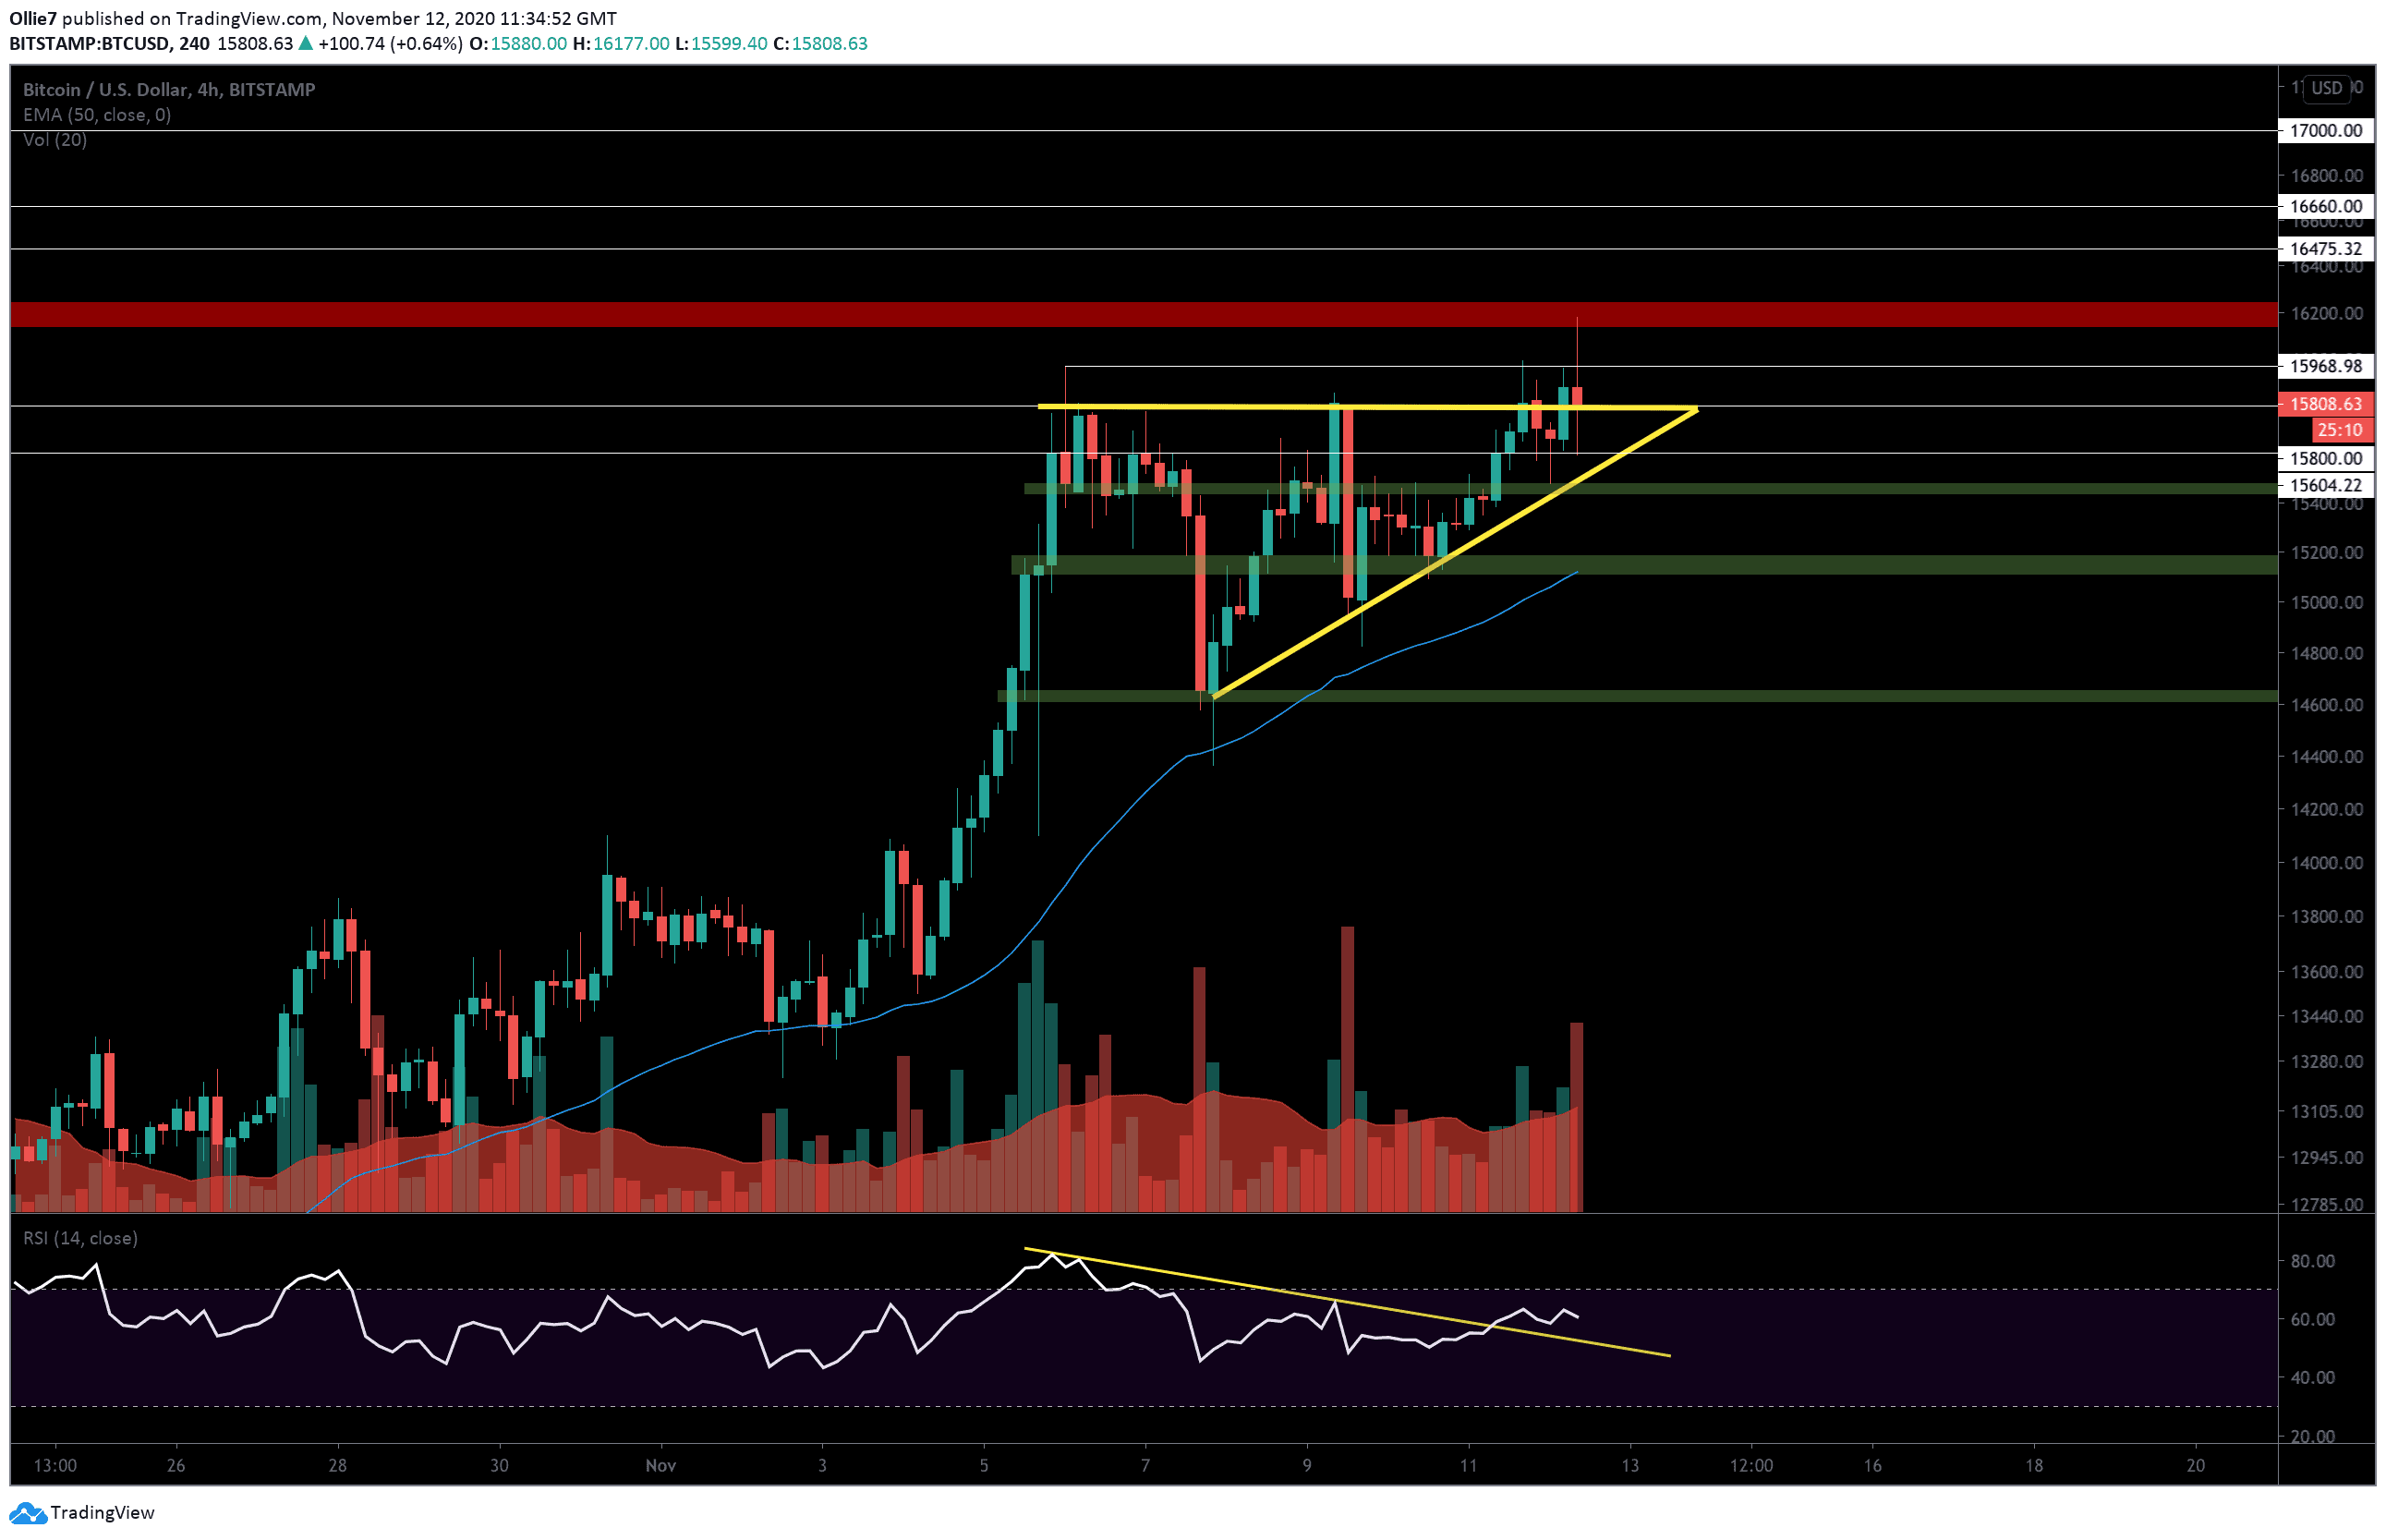
On the 4-hour BTC/USD chart, we can see that the asset has broken out of the bullish ascending triangle and is currently throwing back onto the former resistance and finding new support. Hopefully, bullish traders will be able to hold on to this level and recharge before launching a second rally back towards the new high.
The main resistances standing in the way of bitcoin’s progress right now include the $15,970 and the major resistance zone (red) between $16,150 and $16,250.
Above these targets, we also have further strong daily resistances around $16,475, $16,660, and the next psychological level at $17,000.
If bullish traders fail to hang on to the current support, however, and prices fall back into the ascending triangle pattern, then we will look to the $15,600 support first to help prop prices up against further decline. From there, we have a lower-key support zone (green bar) around the $15,470 level.
Underneath that, we also have a second key support zone around $15,145 that overlaps with the 50-EMA (blue line).
On the RSI, we’d like to see BTC print a new high above 65 to confirm the new momentum is genuine and not just a temporary pump. At the moment, it’s broken above the down-trending resistance (yellow line) but is starting to push sideways.
Total market capital: $461 billion
Bitcoin market capital: $293 billion
Bitcoin dominance: 63.6%
*Data by Coingecko.
Bitstamp BTC/USD 4-Hour Chart