Bitcoin Price Likely to Reach $50K Soon According to This Indicator
Although bitcoin retraced slightly after coming 4% away from $50,000, a well-known indicator has suggested that the cryptocurrency could top that level very soon. This prediction is based on the skyrocketing amounts of stablecoins deposited to centralized exchanges in the past 24 hours.
Bitcoin To Top $50K Soon?
CryptoPotato reported the ongoing craze in the cryptocurrency markets initiated by Tesla’s purchase of $1.5 billion in bitcoin. Naturally, such a massive announcement caused an instantaneous reaction for the BTC price, which surged from $39,000 to a new all-time high of over $48,000 in less than a day.
Bitcoin has retraced slightly since its record and currently hovers above $47,000. However, CryptoQuant data, provided by the company CEO Ki Young Ju, suggests that the asset could be primed for another breakout into uncharted territory.
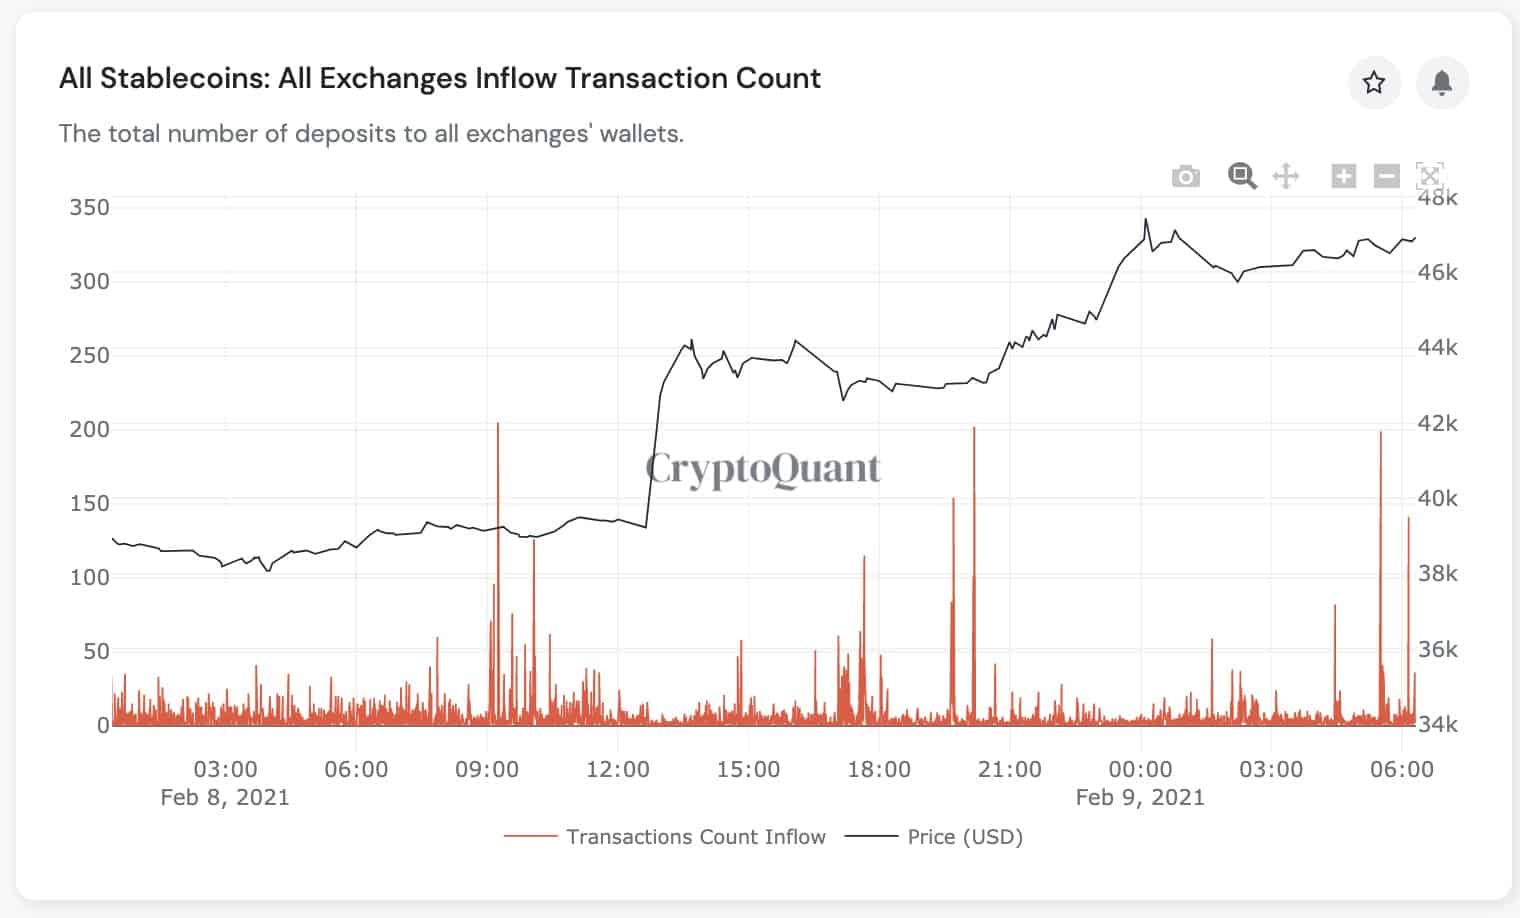
Ju referred to the “stablecoins deposit signal” for his price prediction. The indicator follows the number of deposit wallets in all types of stablecoins flowing into all exchanges by block. If the metric goes above 80, the price will “likely be a short-term bullish like 1-5%.”

As the graph above demonstrates, the metric went well above 80 several times in the past 24 hours. After each, BTC’s price indeed went higher.
Currently, bitcoin is about 6% away from $50,000. Nevertheless, the stablecoin deposits to exchanges are significantly higher than 80, which could indeed prompt a rapid breakout to the coveted price tag.
Fear And Greed Index Goes Parabolic
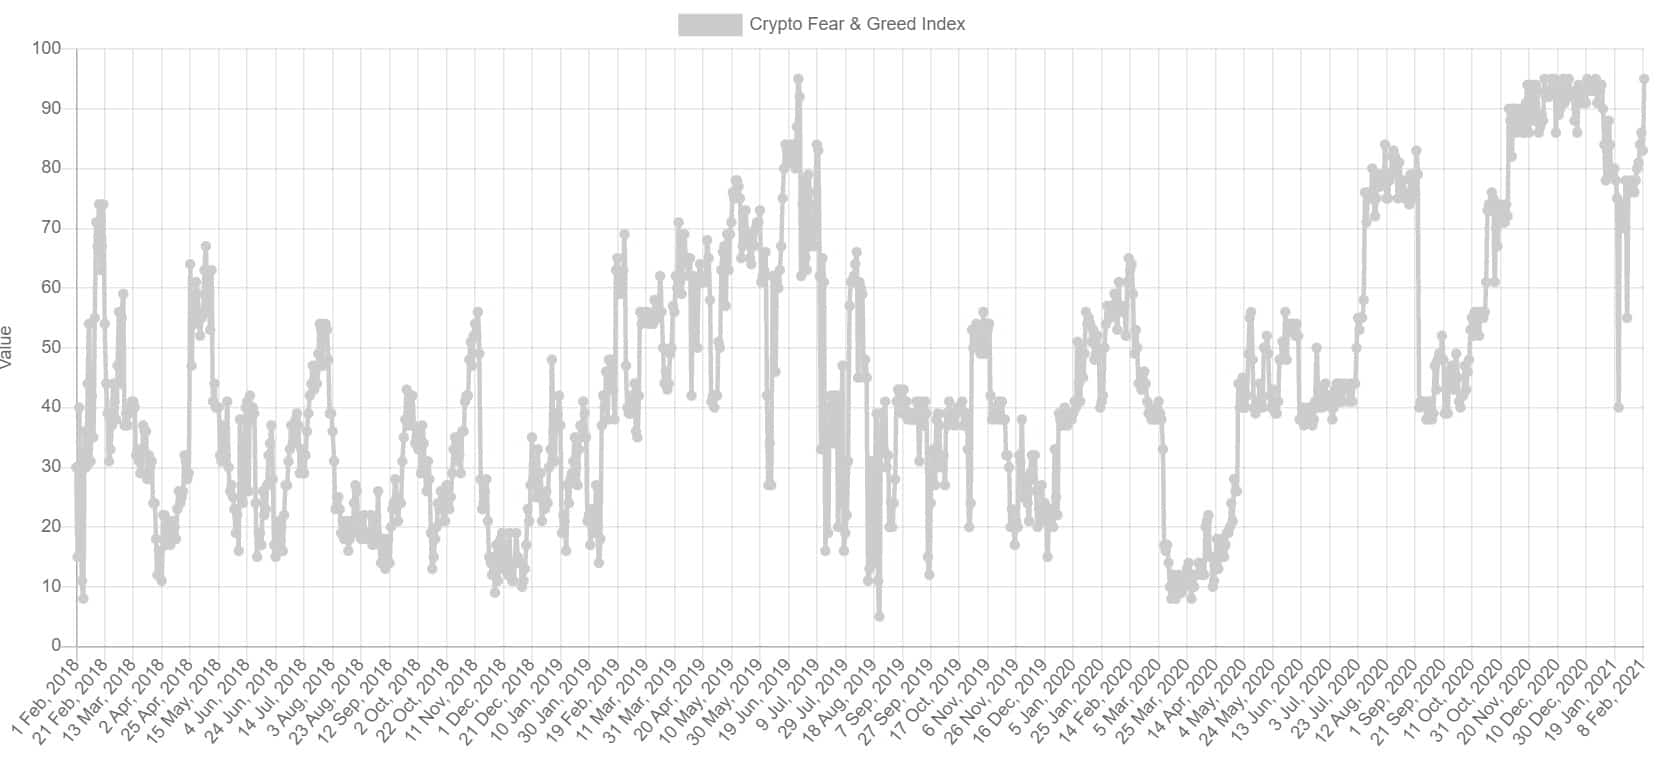
It’s also worth exploring the popular Fear and Greed Index, which calculates various types of data, including volume, surveys, volatility, and social media, to provide the investors’ general sentiments towards the current BTC market landscape.
The results range from 0 (extreme fear) to 100 (extreme greed). Somewhat expectedly, it exploded in the past 24 hours to a state of extreme greed at 95. This is the highest the metric has been since early December when BTC went for another price record at the time.

However, it’s worth noting that the F&G index could also suggest that the asset’s price has entered into bubble territory. In the past, BTC had retraced multiple times when the indicator was in a similar, extreme greed phase.


