Bitcoin Price is Likely To Re-Test $4,400 Before Turning Bullish Again, Prominent Analyst Explains
2019 is approaching its end, and while many crypto enthusiasts have marked 2020 as the next Bitcoin bull-run, it is mostly because of the anticipated halving event.
While there is a consensus that the halving will propel Bitcoin price to new highs, some analysts see the cryptocurrency visiting lower values before we can even start speaking about any possible bull-run.
Bitcoin started 2019 at $3,700, skyrocketed to $13,880 on the 26th of June, retraced, surged back up, and most recently pulled down to a current low of $6,500 after another volatile November. This far, December has been bullish for Bitcoin, as the cryptocurrency is trading safely above $7000.
When trying to predict how the year will end from a technical analysis standpoint, prominent crypto analyst Eric Crown, said that we could be in for more pain.
Speaking on the Crypto Zombie channel, Crown said that the price of Bitcoin might keep heading south with a lower target of $4,400, and this is likely to take place in the short term, maybe before the end of the year.
Bearish 2020? Bitcoin to re-test $4,400
“This market is a long way away from being bullish,” – Crown said, adding that we would need to see a break above the $9,800 price area in order to start thinking bullish again.
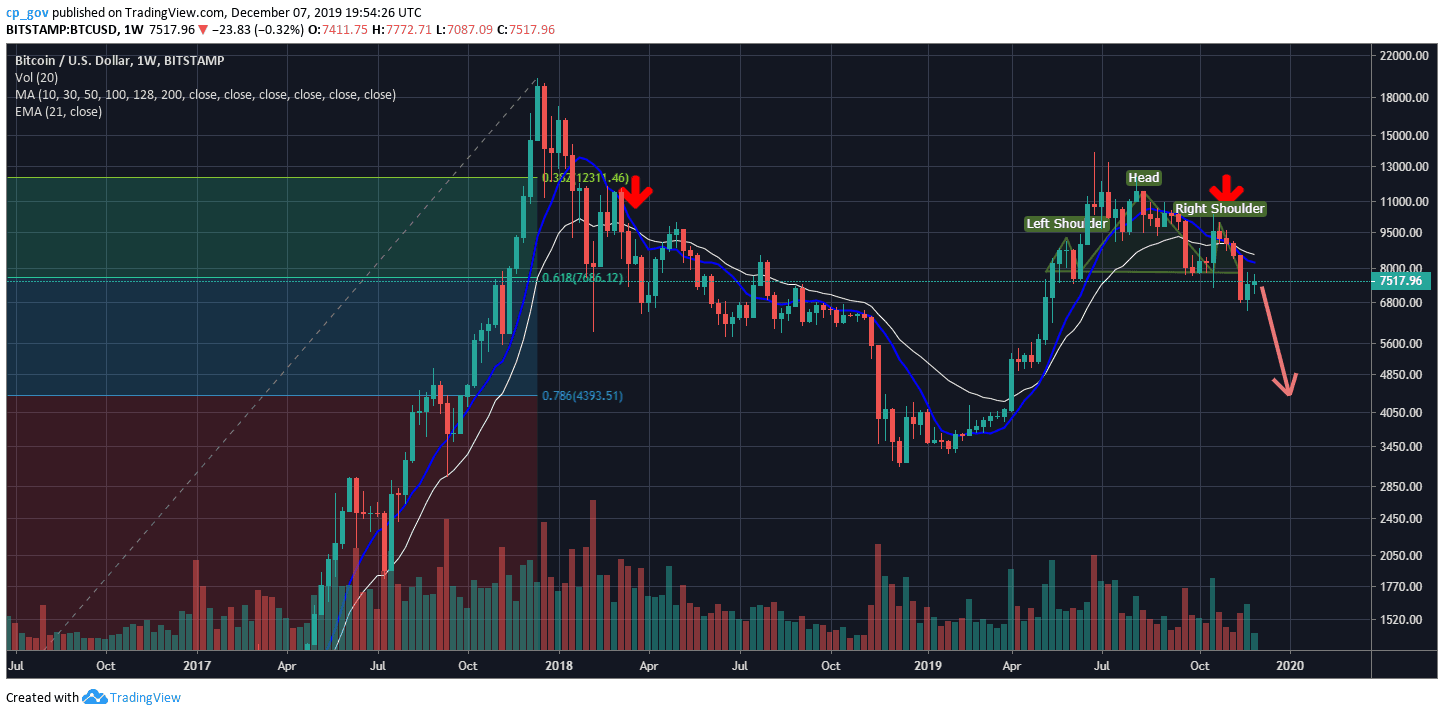
To arrive at his $4K target, Crown used longer-term indicators on Bitcoin’s weekly chart. One of the main drivers of the $4,400 price prediction is the fact that every time the 21 weekly EMA (exponential moving average, marked by a blue line on the following chart) crosses below the 10 weekly SMA (simple moving average, marked by a white line on the following chart), the market responds with a 65% – 75% price decline.
This is, of course, under bearish conditions (like we have now). If that’s to be the case, we could expect a drop towards $4,400, given the highs of 2019, which were around $13,800.
The last time such cross down took place was in March 2018, while Bitcoin was trading at $8300, and we all know how it ended up eight months later during bloody November 2018. Both cross downs are marked by bold red arrows.

Another driver is the fact that there is a head and shoulders bearish pattern that is visible on the above weekly chart. Two weeks ago Bitcoin closed below the “neckline,” which is roughly around $7800 – $7900. Even the greatest hater of Bitcoin, Peter Schiff, noticed this head and shoulders formation. The Head and Shoulders’ target is, you guessed, around the $4400 area as well.
#Bitcoin is below the neckline of the head-and-shoulders top. Not all head-and-shoulders tops fulfill their potential. If they did it would be too easy. Just find a broken neckline and bet the farm. But a lot of the time they do, which is why the pattern is so widely followed.
— Peter Schiff (@PeterSchiff) November 22, 2019
Adding further to this, the Fibonacci retracement level 78.6% of the 2017 bull-run lands exactly on $4390. This level is also marked on the above chart.
All of the above factors combined lead Crown to believe that, in case Bitcoin will continue lower, the price will decrease to the range between $4,000 and $4,400 before the next market cycle.
2018: Same story but different
This is not the first time former analysts predict 40-50% Bitcoin price declines. During the first half of November 2018, Jonathan Berger, CryptoPotato’s market analyst, predicted the breakdown of the 2018 horizontal support level at $6000 (the bearish triangle’s breakdown), with a price target of $3000. As we all remember, Bitcoin reached its yearly low at $3120 (Bitstamp) during December 2018.
The post Bitcoin Price is Likely To Re-Test $4,400 Before Turning Bullish Again, Prominent Analyst Explains appeared first on CryptoPotato.


