Bitcoin Price Finally Breaks Bullish: $12,000 Here Again, Could BTC Target a New 2019 High? Analysis & Overview
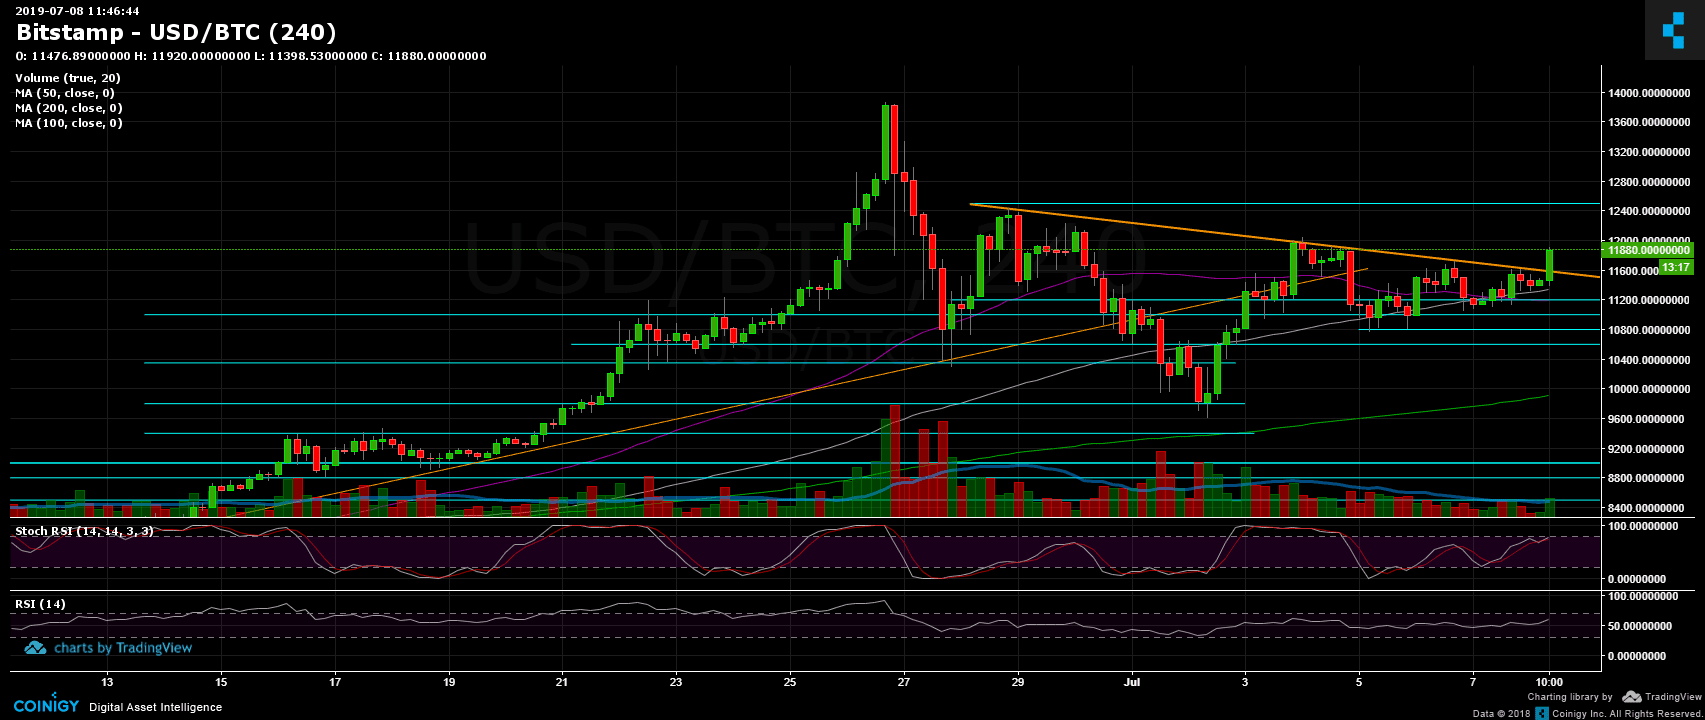
In our previous analysis two days ago, we discussed the descending trend line which had been tested and rejected several times.
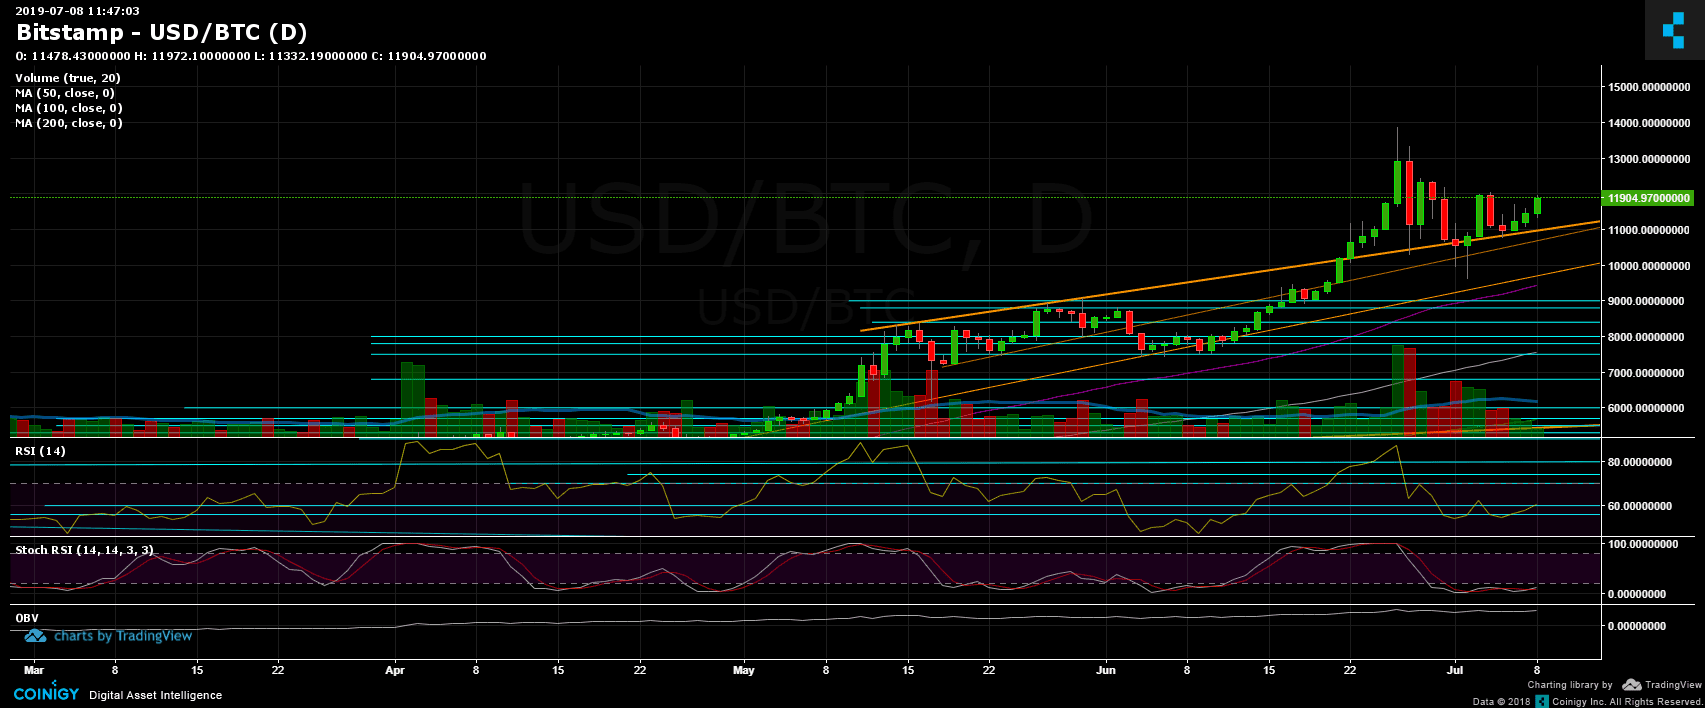
Along with the descending trend line, there was the critical mid-term ascending trend line (daily chart) which was maintained nicely by the price action.
With the decreasing daily volume and the triangle formation, it was only a matter of time until Bitcoin broke out in either direction. We have pointed out reasons for believing that the situation was bullish. And just an hour ago, Bitcoin saw a massive spike to the bullish side, breaking the descending trend line and facing resistance at $12,000 as of the time of writing.
Total Market Cap: $336 billion
Bitcoin Market Cap: $211 billion
BTC Dominance Index: 62.9%
*Data by CoinGecko
Now What?
Support/Resistance: Following the breakout of the critical $11,500 – $11,600 resistance level, Bitcoin is now facing the $12,000 resistance area. The next target lies at $12,200 (the top from June 29), before stronger resistance at $12,500. Breaking up, and Bitcoin would be aiming for the 2019 high of $13,500 – $13,880.
From below, the nearest support now lies at $11,800, before the resistance-turned-support area at $11,500. Further below is $11,200, $10,800 and $10,300. Below $10K are the $9,800 and $9,400 levels (the local high along with the daily chart’s 50-day moving average line).
From the bearish side, the closest support lies at $11,200, followed by $11K and $10,800 (the low from yesterday). A break below the latter, combined with the ascending mid-term trend line on the daily chart, and the short-term would turn bearish. Further below lies $10,600, $10,300 and $9,800. There is also the $9,400 high from June, along with the daily chart’s 50-day moving average line.
Daily chart’s RSI: The RSI is gaining momentum nicely; however, to continue upward, Bitcoin’s RSI will need to create a higher high and surpass 62-63, which is the most recent high. The Stochastic RSI oscillator has done a crossover and is about to enter bullish territory, which could ignite a BTC rally.
Trading Volume: the recent spike was followed by a huge amount of volume, following days of decreasing volume in anticipation of a move.
Bitfinex open short positions: Following the spike, many traders opened new short positions. There is now 12.7K worth of BTC short positions, which is a 12% increase.
BTC/USD Bitstamp 4-Hour Chart

BTC/USD Bitstamp 1-Day Chart

The post Bitcoin Price Finally Breaks Bullish: $12,000 Here Again, Could BTC Target a New 2019 High? Analysis & Overview appeared first on CryptoPotato.


