Bitcoin Price Facing Its First Major Test of 2020, Which is On The Weekly: BTC Analysis & Overview
Bitcoin had seen a grand opening to the new decade, following a decent surge of roughly $1000 in the first days of 2020.
After reaching a high of $8400 last Wednesday, Bitcoin had encountered resistance and quickly turned around. However, the coin continues to look healthy and positive, consolidating safely above the $8000 benchmark.
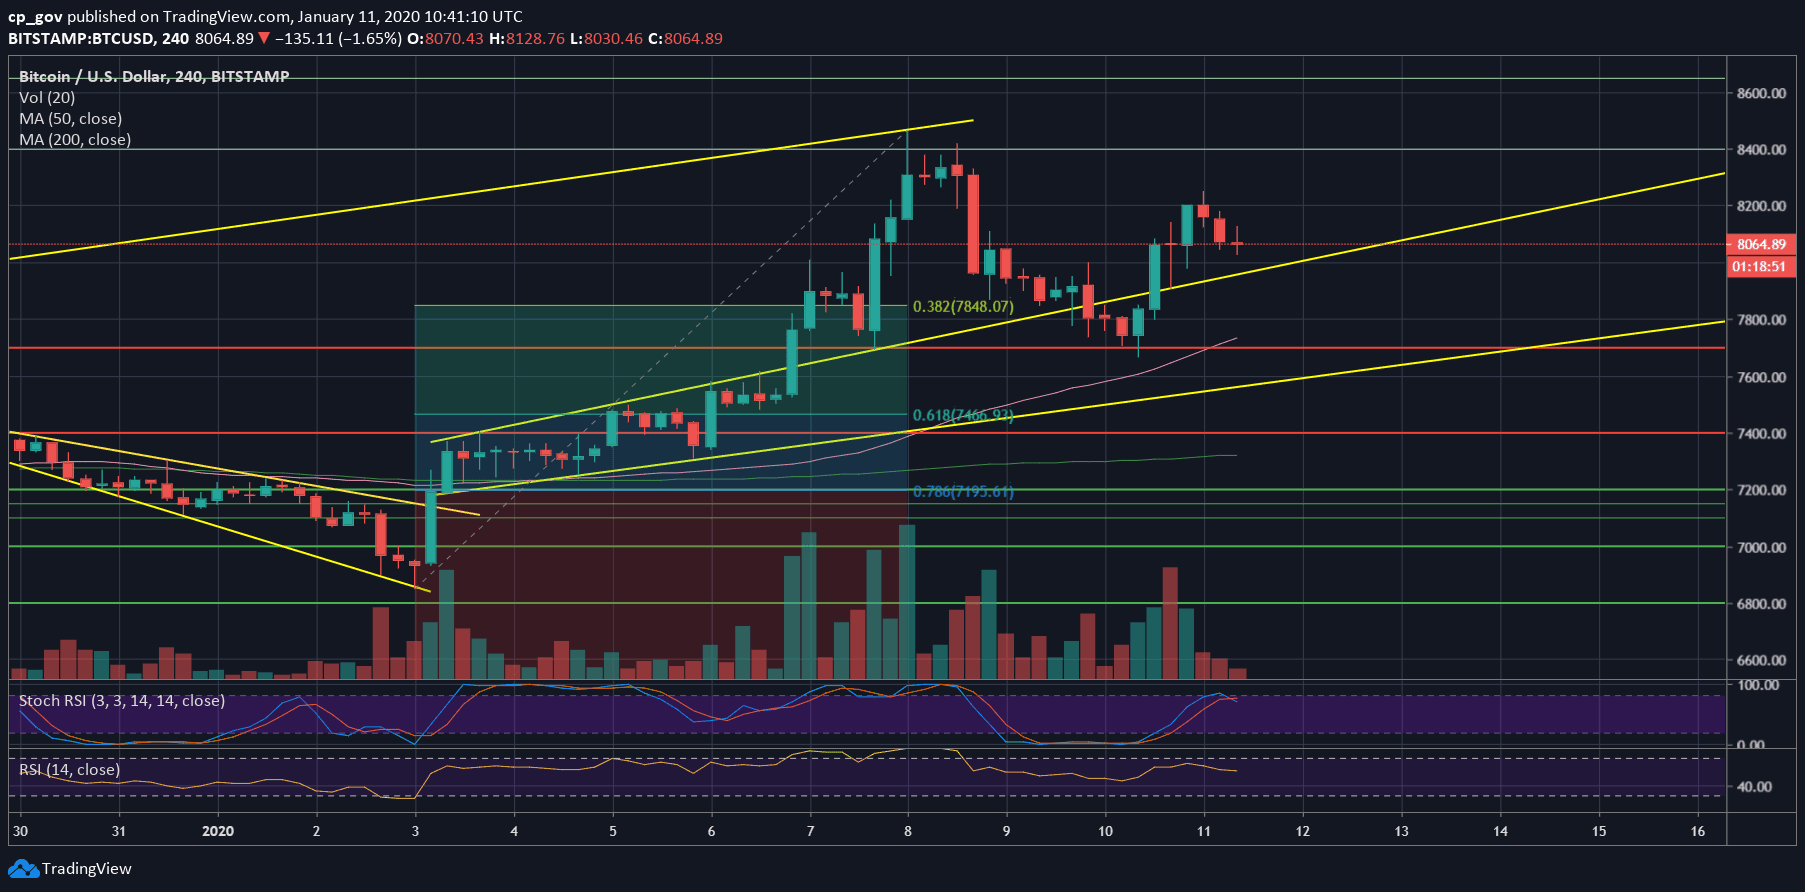
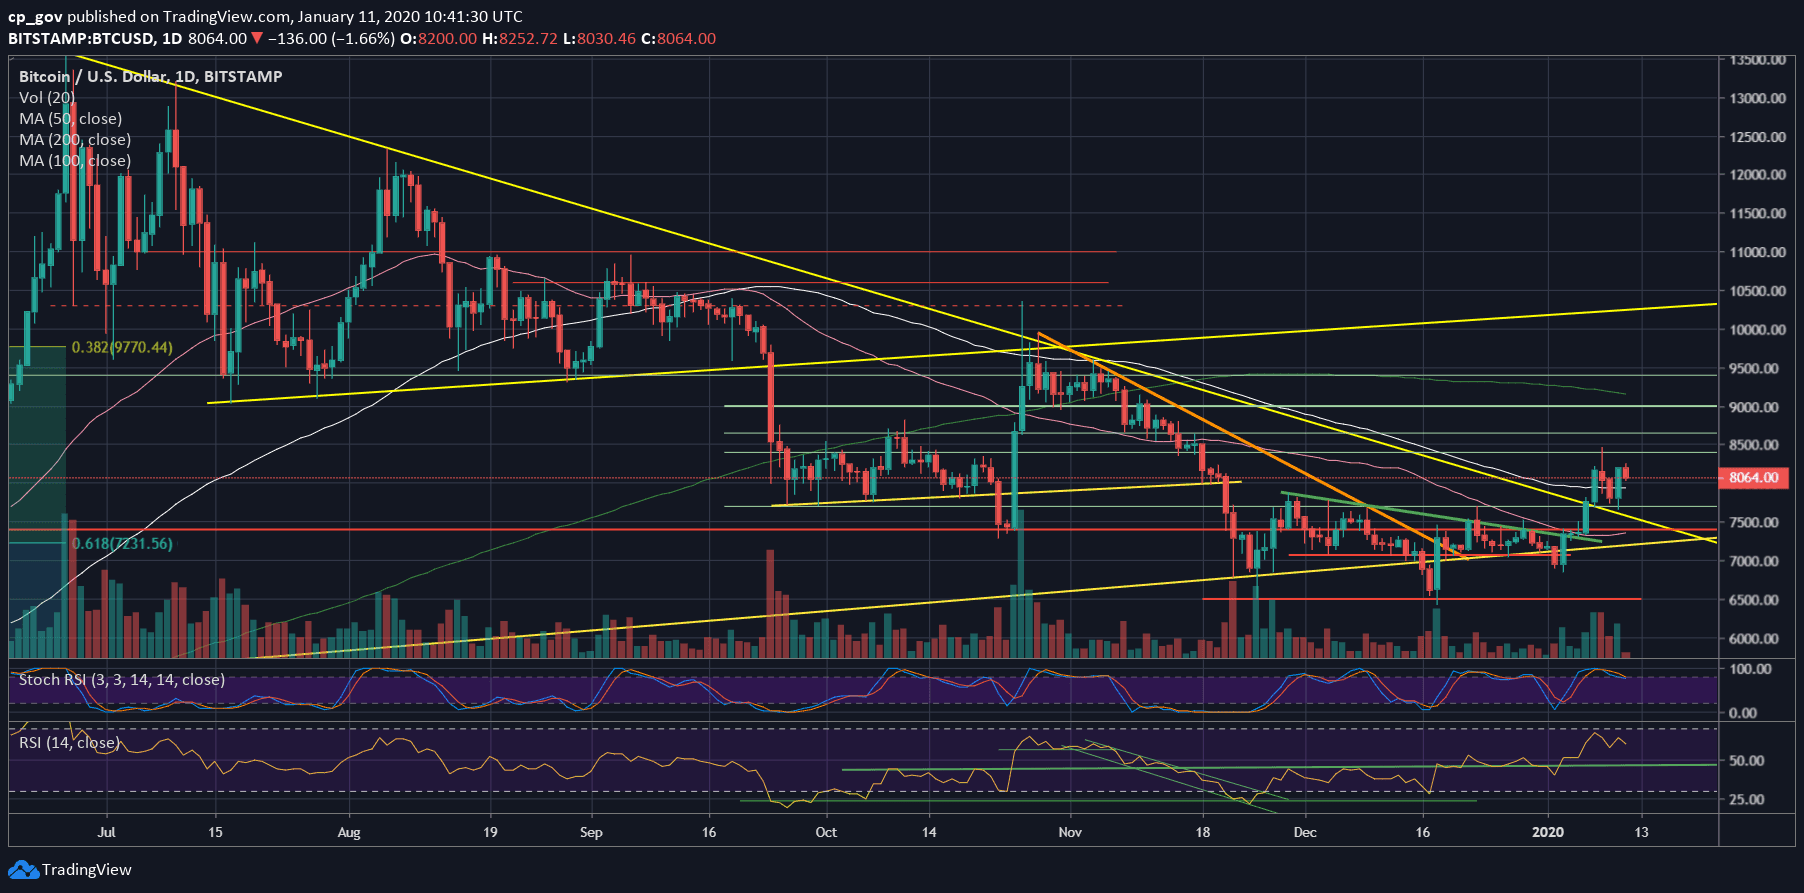
Yesterday we saw Bitcoin gearing down towards the $7700 support, along with the crucial mid-term descending trend-line (that was started forming during June 2019, marked on the following daily chart).
Bitcoin touched it, in order to confirm the line as resistance-turned-support level, and from there, quickly turned its pace back up to where it trades as of writing these lines.
As mentioned above, the short-term looks bullish. In the longer term, the next real test might be the 200-days moving average line, which is currently around $9200.
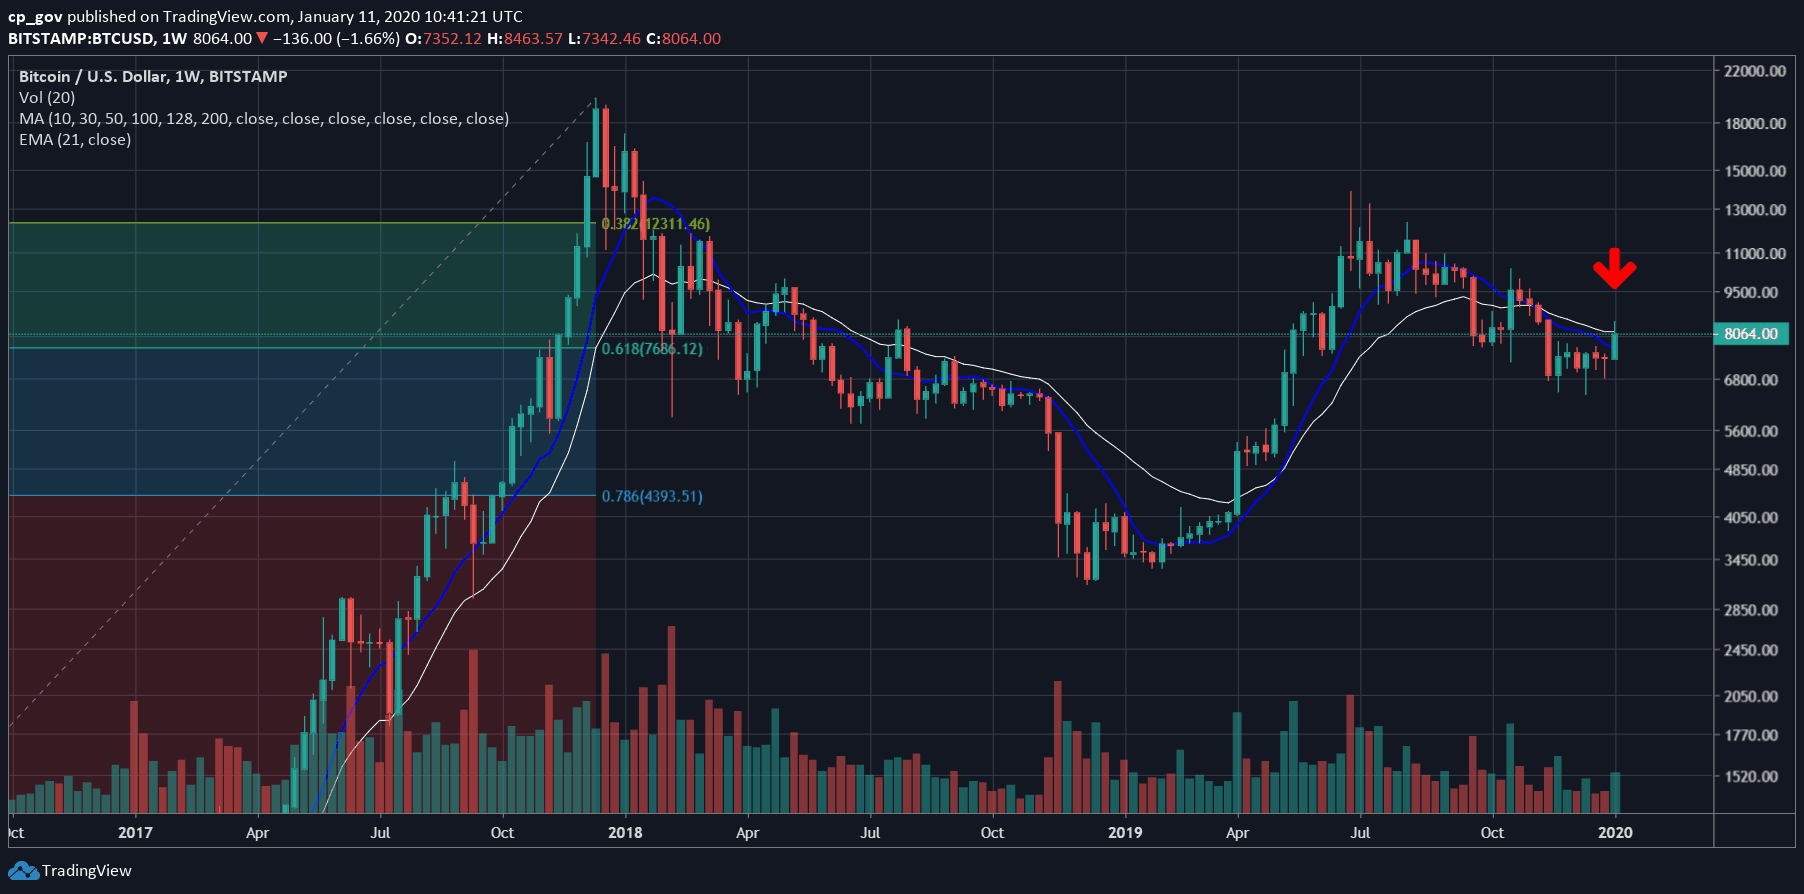
Looking at the bigger time-frame, the weekly chart, we can see Bitcoin reaching accurately onto the white line, which is the critical moving average 21 weeks. The bulls would seek a weekly candle close above $8200, and another green candle for the following next week.
Total Market Cap: $216 billion
Bitcoin Market Cap: $147 billion
BTC Dominance Index: 68.0%
*Data by CoinGecko
Key Levels To Watch & Next Targets
– Support/Resistance levels: As of now, Bitcoin is safely consolidating above $8000, which is the first support. A little below lies $7850 and $7700. Further down is the $7466 (the 61.8% Fib retracement level), and $7300 – $7400.
From above, the first level of resistance is the $8300 – $8400 price area, which is the high from last Wednesday. In case of a breakout, then Bitcoin will likely test $8600 and $8800 (stronger resistance), before $9000 and the MA-200 (light green line on the following daily chart, ~$9200).
– The RSI Indicator: The momentum indicator is tracing the recent price action, and so far – so good.
A bearish sign might be coming on behalf of the Stochastic RSI oscillator: The last had gone through a bearish crossover and is about to enter the neutral territory.
– Trading volume: As expected, the past two days of consolidation were followed by smaller volume candles; however, compared to the past month, the volume levels of the past week were decent high.
BTC/USD BitStamp Weekly Chart
BTC/USD BitStamp 4-Hour Chart
BTC/USD BitStamp 1-Day Chart
The post Bitcoin Price Facing Its First Major Test of 2020, Which is On The Weekly: BTC Analysis & Overview appeared first on CryptoPotato.