Bitcoin Price Eyes Move to $6.8K After Bull Breakout
Bitcoin could be about to make a move towards $6,800, having witnessed a bullish triangle breakout yesterday.
The leading cryptocurrency, which had been in a narrowing price range, closed at $6,423 yesterday, confirming an upside breakout.
With the move, the bulls look to have come out victorious in a months-long tug-of-war with the bears. However, BTC is struggling to find acceptance above the immediate resistance of the 50-day exponential moving average (EMA), currently at $6,450.
However, the EMA hurdle could be crossed in a day or two and prices could rise to $6,800 in the near-term, as the ethereum-bitcoin exchange rate (ETH/BTC) is looking north, representing a rising demand for alternative cryptocurrencies.
This is because fiat money enters the market via BTC. As a result, it’s dollar-denominated exchange rate tends to go up during times of increased risk appetite in the market.
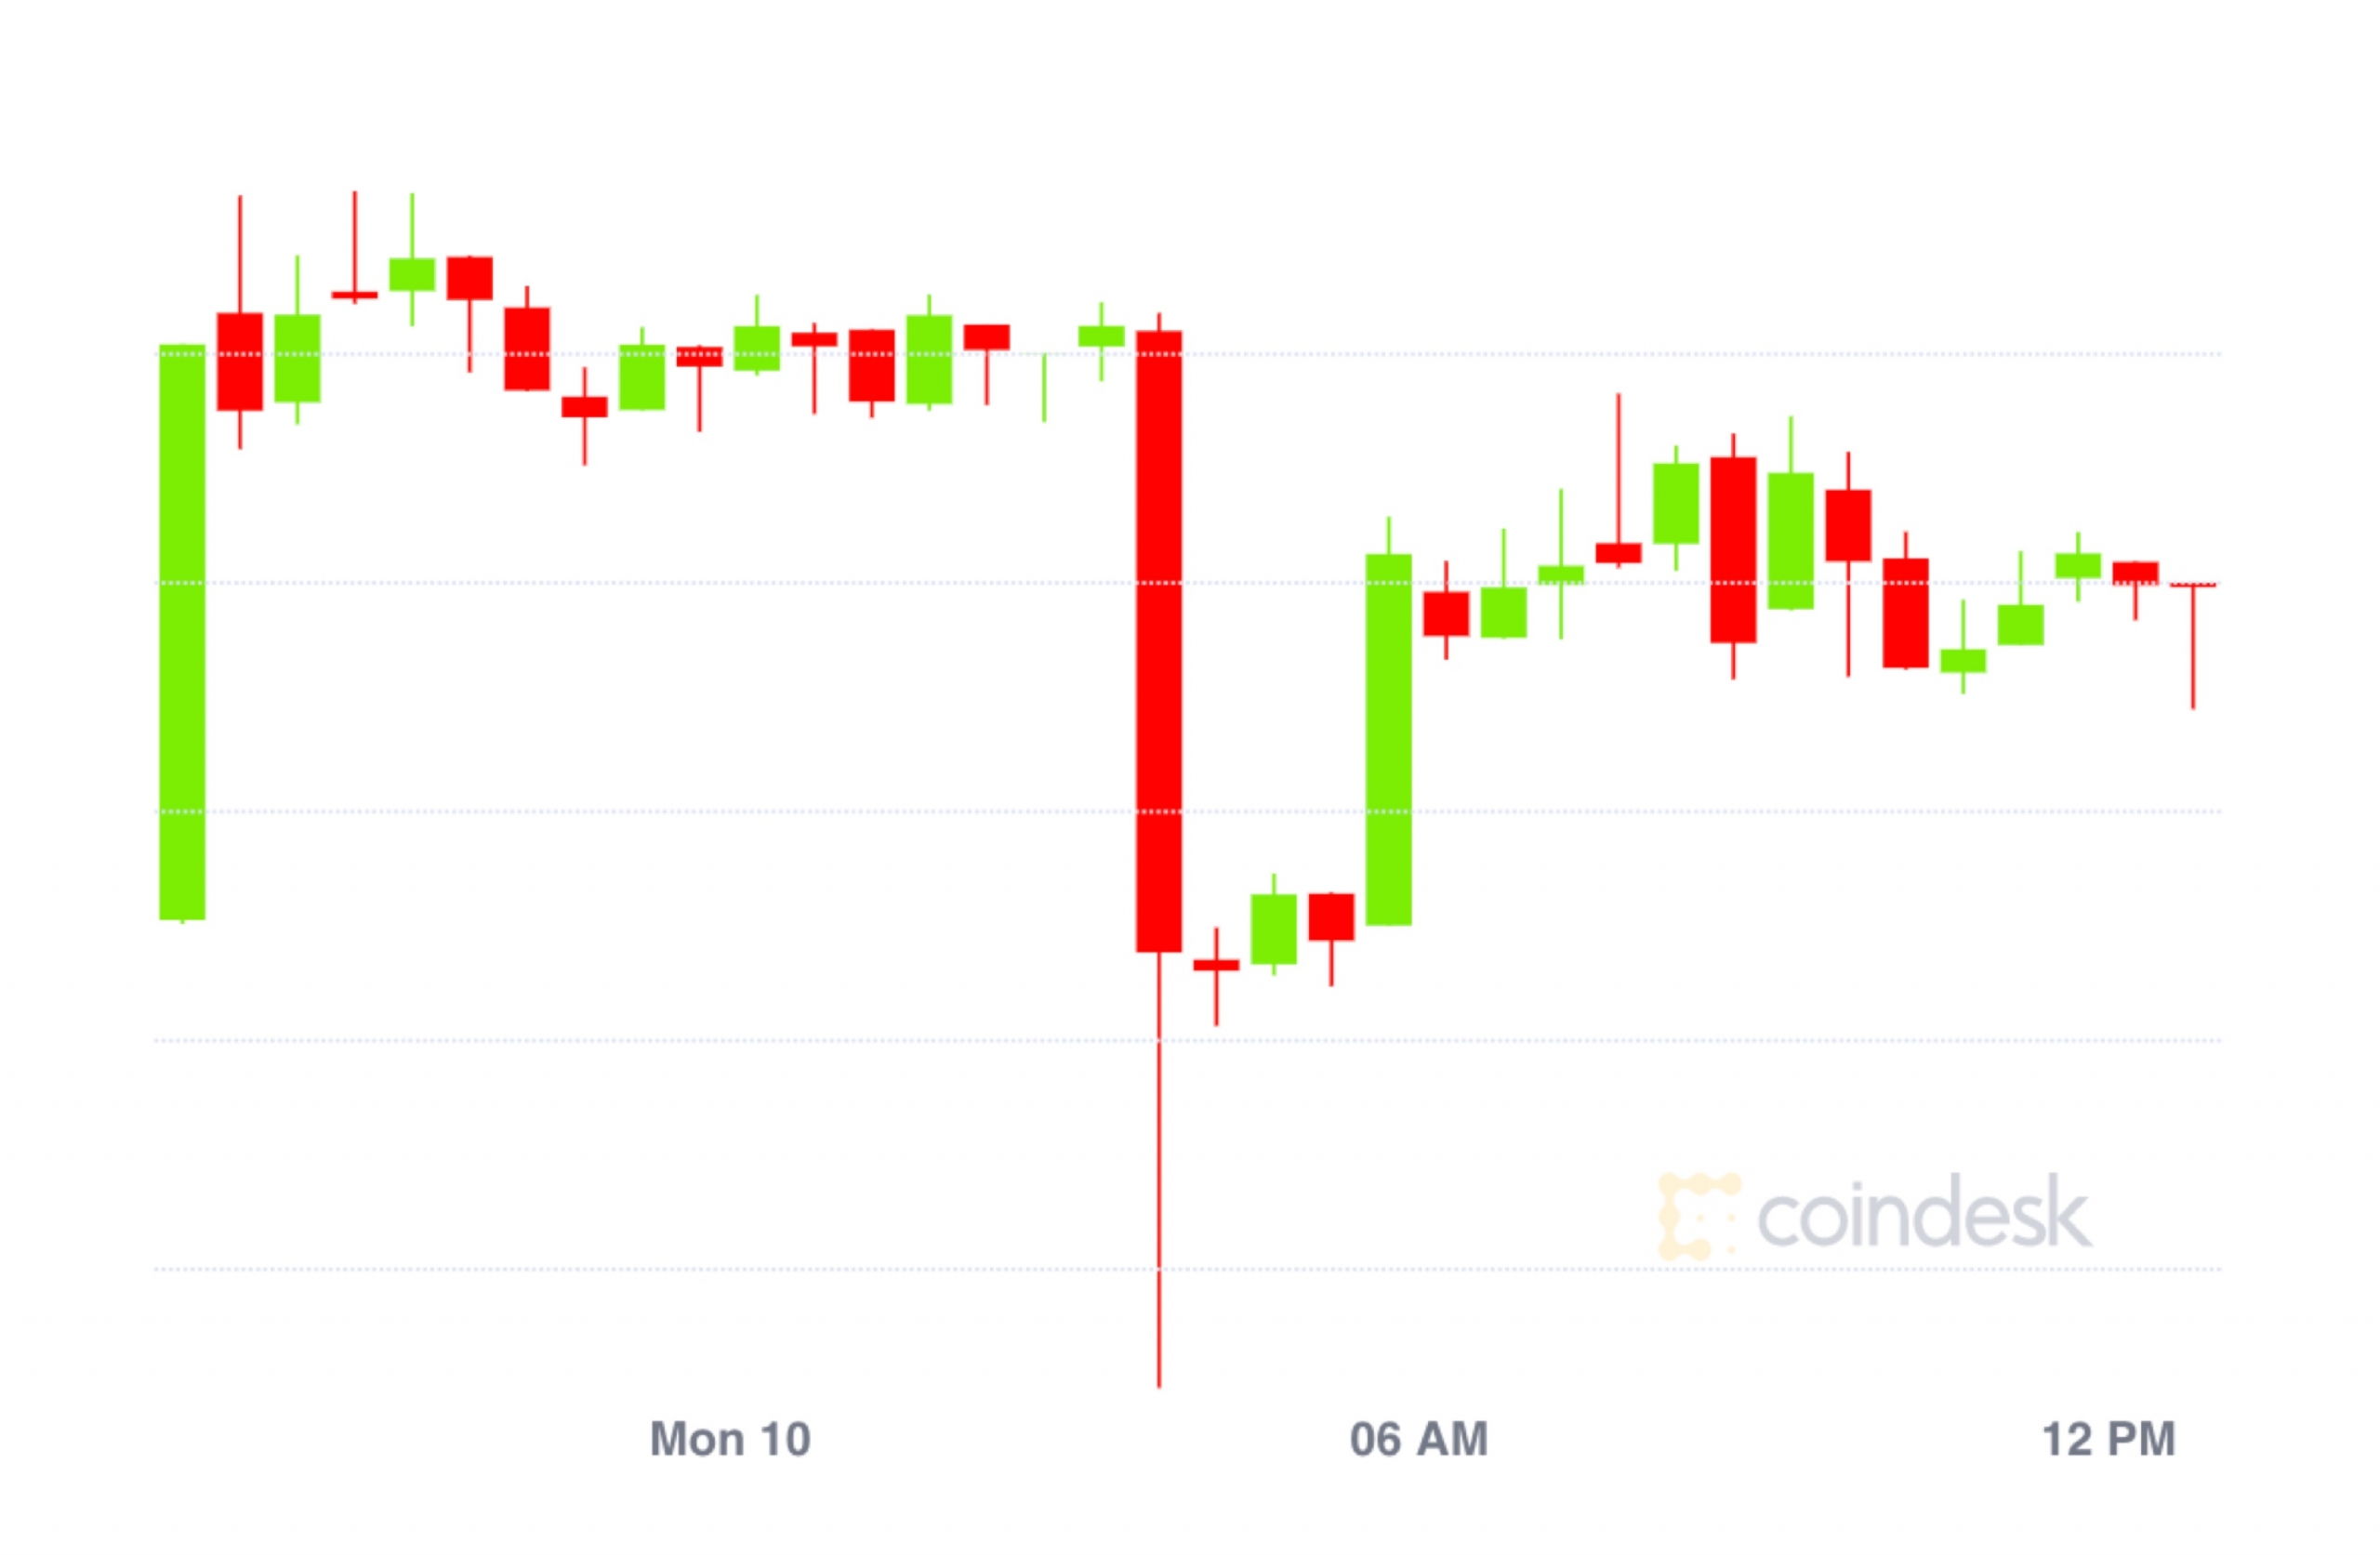
At press time, BTC is changing hands at $6,400 on Coinbase, having clocked a high of $6,440 earlier today. The cryptocurrency is up 1 percent on a 24-hour basis and is largely unchanged week-on-week.
Daily chart

The symmetrical triangle breakout seen in the above chart indicates the scope for a retest of recent highs above $6,800.
That target looks achievable as the breakout is backed by a bullish crossover on the moving average convergence divergence (MACD). Further, the relative strength index is holding in a bullish territory just above 50.00.
ETH/BTC daily chart

The falling channel breakout and a convincing move above the former support-turned-resistance of 0.031994 (Sept. 25 low) indicates a bearish-to-bullish trend change.
The rising MACD histogram is suggesting that further gains could be in the offing. The RSI of 53.00 is biased toward the bulls.
Thus, ETH/BTC looks set to rise in the near future.
View
- Both BTC and the ETH/BTC are looking north after the technical breakout.
- An increased risk appetite is seen lifting BTC above the 50-day EMA of $6,450. That would open the doors for a sustained rally to $6,810 (Oct. 15 high).
- The short-term bullish outlook in BTC would be invalidated if prices see a UTC close below Oct. 31 low of $6,200.
Disclosure: The author holds no cryptocurrency assets at the time of writing.
Bitcoin image via CoinDesk archives; charts by Trading View
Join 10,000+ traders who come to us to be their eyes on the charts and sign up for Markets Daily, sent Monday-Friday. By signing up, you agree to our terms & conditions and privacy policy
The leader in blockchain news, CoinDesk is a media outlet that strives for the highest journalistic standards and abides by a strict set of editorial policies. CoinDesk is an independent operating subsidiary of Digital Currency Group, which invests in cryptocurrencies and blockchain startups.