Bitcoin Price Could Dive To $6K If It Falls Below $8,500 Soon, According To The Wyckoff Pattern
By examining a well-known technical component, the popular YouTuber The Moon believes that Bitcoin could be heading towards $6,000 in the next few months if it breaks the vital $8,500 level.
Bitcoin And The Wyckoff Distribution Pattern
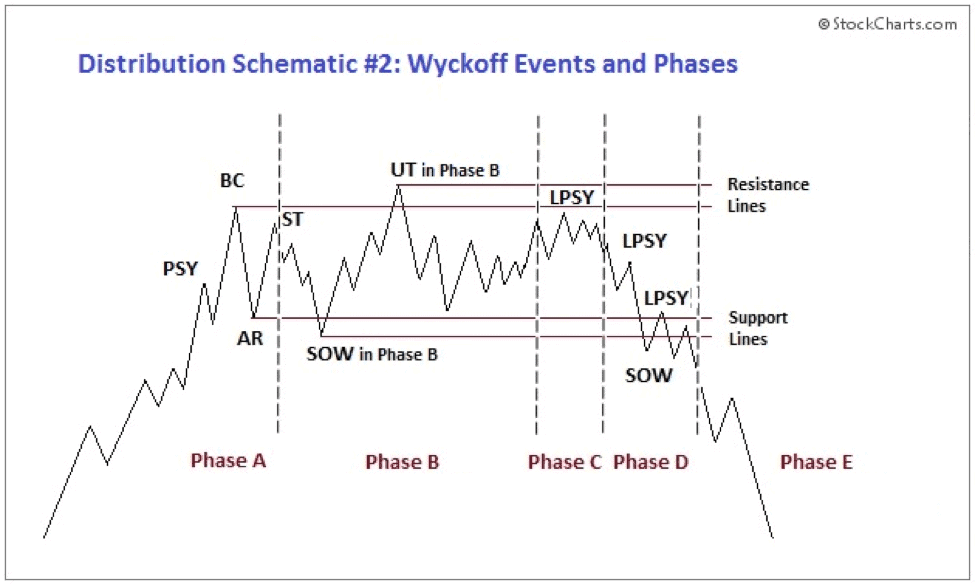
The cryptocurrency analyst initially posted the chart on Twitter in which he has inserted BTC’s current position on the Wyckoff distribution pattern. It works as a medium-term technical instrument that begins in a preliminary supply stage (PSY) where the asset’s “volume expands, and price spread widens.”

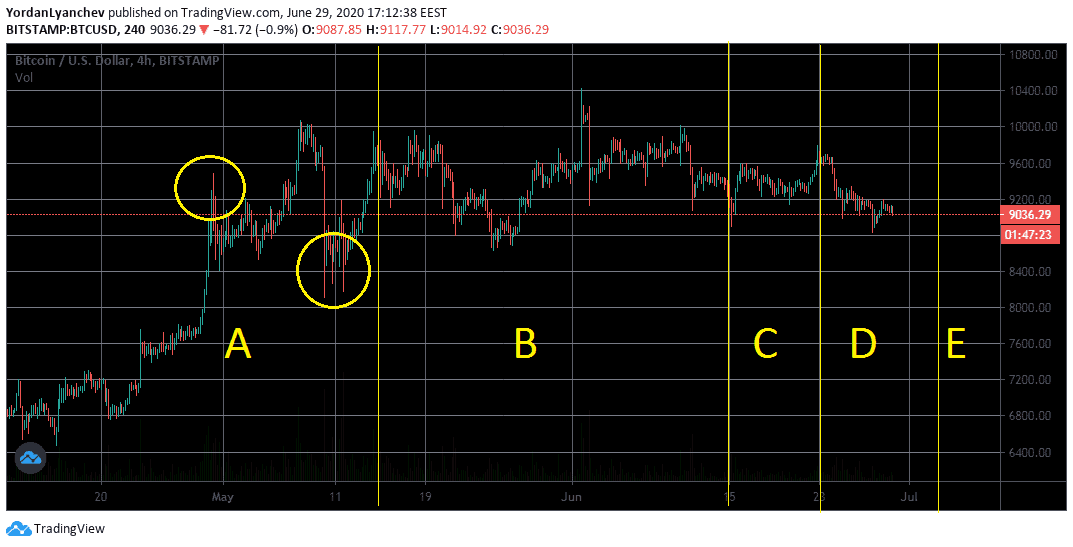
The “Phase A” marks the “stopping of the prior uptrend.” In Bitcoin’s case, this came in late April and early May when the asset was recovering from the March lows. The “buying climax” appeared afterward, followed by the “automatic reaction” (AC) that brought BTC down and a “secondary test” (SC) of the BC, which spiked it back up.
“Phase B” is the most extended stage of the development of the distribution pattern. Its purpose is “to build a cause in preparation for a new downtrend,” as “institutions and large professional investors are disposing of their long inventory and initiating short positions.” In the BTC scenario, this occurred between the halving in May and mid-June.
“Phase C” is a “test of the remaining demand. It is also a bull trap – it appears to signal the resumption of the uptrend but, in reality, is intended to “wrong-foot” uninformed break-out traders.” Such a bull trap for Bitcoin could be the latest attempt to break the $10k mark a few weeks ago.
Is $6K In BTC’s Future?
According to The Moon, the primary cryptocurrency is currently situated in “phase D,” during which the price “travels to or through a trading range (TR) support.” The Wyckoff distribution pattern asserts that if the asset breaks the previous lows, it could head south rather rapidly in “phase E.”

For Bitcoin, this crucial level is $8,500. It’s the low from mid-May when it flirted several times with that support but ultimately remained on top. The Moon warned that if the primary cryptocurrency breaks it, BTC could lose over 30% of its value in the upcoming weeks and find itself at $6,000. If the level holds, however, Bitcoin could rise again up to $10,000.
Interestingly, another popular cryptocurrency content creator and analyst, Tone Vays, recently said that Bitcoin will trade in this particular range from $6,000 to $10,000 until the end of the year.
The post Bitcoin Price Could Dive To $6K If It Falls Below $8,500 Soon, According To The Wyckoff Pattern appeared first on CryptoPotato.


