Bitcoin Price Continues To Drop With Seven Daily Red Candles
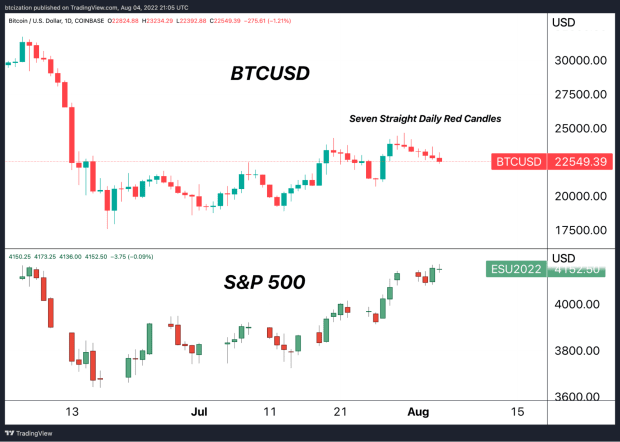
As equities continue to bid, bitcoin’s price action has started to meaningfully turn over, but while the S&P 500 rallies while bitcoin doesn’t follow.

The below is an excerpt from a recent edition of Bitcoin Magazine Pro, Bitcoin Magazine’s premium markets newsletter. To be among the first to receive these insights and other on-chain bitcoin market analysis straight to your inbox, subscribe now.
Bitcoin And The S&P 500
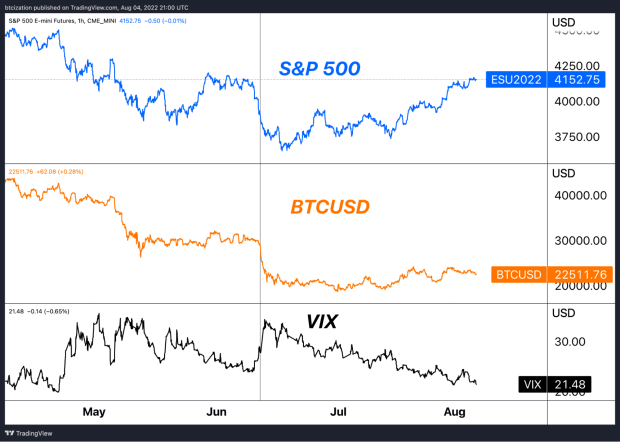
In our latest monthly report, which focused extensively on the evolving macroeconomic environment, we highlighted the strong correlation between bitcoin and equities over the course of 2020, while also referring to bitcoin as a quasi-24/7/365, inverse VIX (currently). Generally, this means that when equities are bidding, bitcoin has gotten a lift as well; and when equities are selling off (likely alongside a rise in the VIX), bitcoin would face downside pressure as well.
Market participants should recall that following the implosion of LUNA/UST, bitcoin was consolidating around the $30,000 for nearly a month before equity market volatility increased as stocks took a new leg lower, which pulled bitcoin down without key support.

So what stands out in the current trend? Well, both markets have exogenous variables that can affect price and historical realized correlations. As equities continue to bid, as a result of passive flows and a squeeze of late bearish positioning, bitcoin’s price action has started to meaningfully turn over, with its derivative market short squeeze largely occurring already.
Bitcoin notably is in the midst of its seventh red daily candle in a row (lower closing price than opening).

Given that equities have been in a broader uptrend, the underperformance over the short term is concerning for bulls, as one should ask themselves where bitcoin will trade if/when equity markets turn lower and/or legacy market volatility significantly increases.
While this issue is focused less on long-term fundamentals and more on short-term price action, this aligns with our broader market thesis that risk assets haven’t bottomed, as covered in our July Monthly Report. Macro rules all at the current moment, and given bitcoin’s still nascent place as a mere pond amid a global ocean of total assets, realized correlations and relative underperformance are expected and noteworthy, respectively.


