Bitcoin Price Breaks Down Towards $7000: The Indicators Anticipating a Huge Move Coming-up
Over the past three days, Bitcoin was ‘stuck’ between the significant price range of $7300 – $7400. This range is familiar to Bitcoin, as the cryptocurrency struggled there for an extended period during November.
The last time Bitcoin broke down from that range; it resulted in a daily candlewick down to $6500, which is the lowest price of Bitcoin since May 17, 2019.
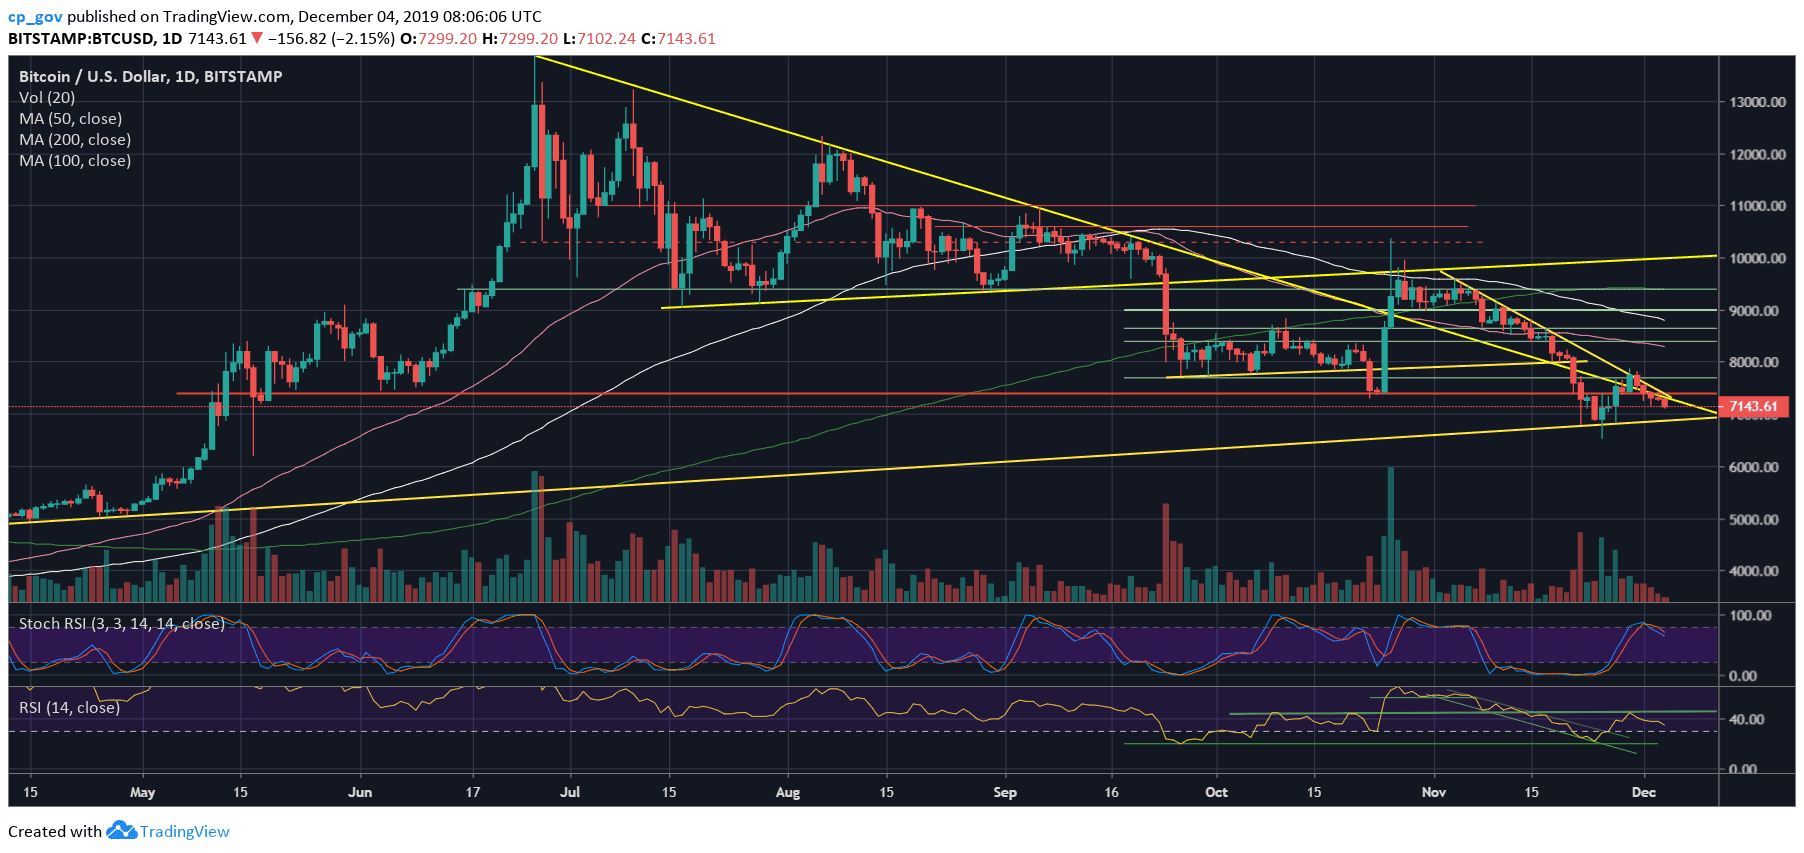
Besides, on the daily chart, Bitcoin encountered two major descending trend-lines and couldn’t overcome beyond them.
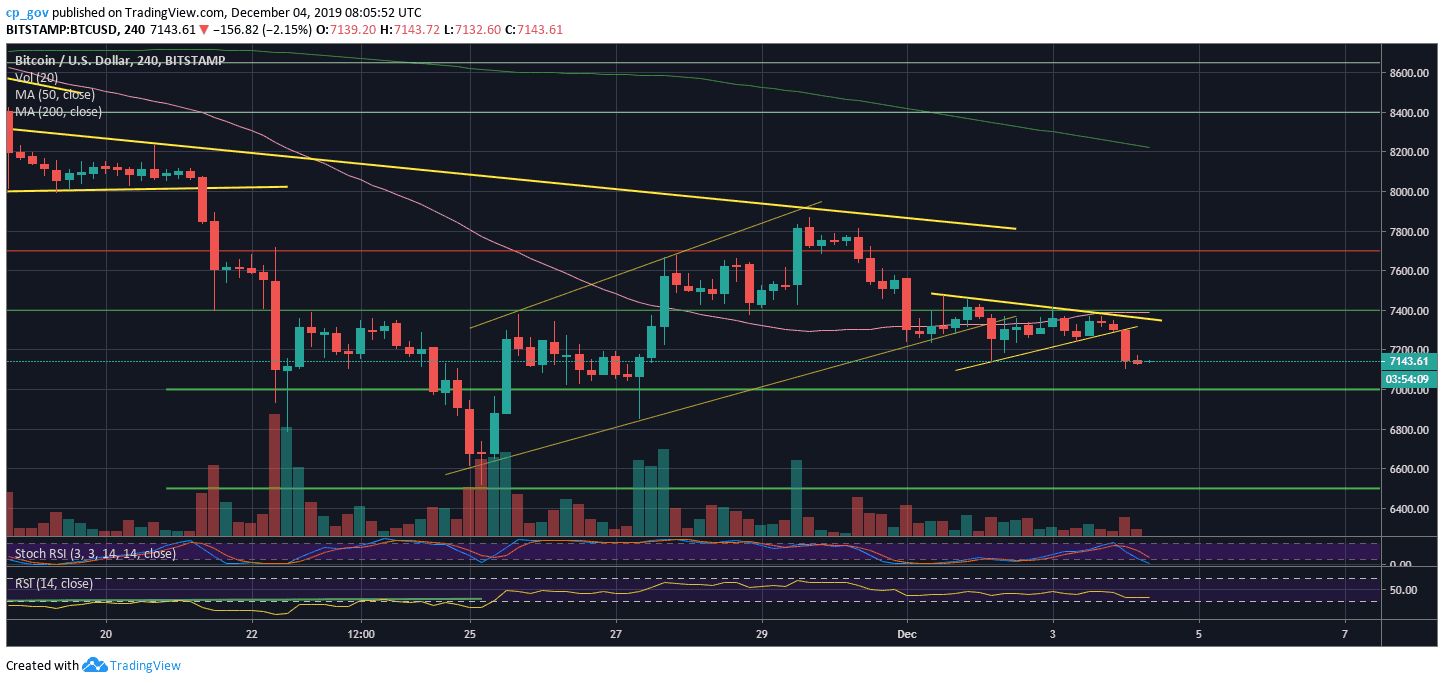
A few hours ago, Bitcoin saw a decision regarding the triangle mentioned above. Like the recent Bitcoin price action, the breakout was to the downside. As of writing this, $7100 is the new weekly low, but of course, this can change now, as you’re reading these lines.
Total Market Cap: $194.9 billion
Bitcoin Market Cap: $129.9 billion
BTC Dominance Index: 66.7%
*Data by CoinGecko
Key Levels to Watch
– Support/Resistance: Following another break to the downside, Bitcoin is facing the $7000 – $7100 support as its next support. A little below lies $6900, which is the daily ascending trend-line, started forming in the month of April. a daily candle never closed below it for more than six months.
The next level of support lies at $6800, whereas the next one is $6500, which is the lowest price of Bitcoin since May 17.
From above, following the breakdown from the confluence zone of $7300 – $7400, this had officially become the first area of resistance. In case of a break-up, which is hard to be seen now, the next resistance lies at $7700.
A real market reversal could take place, in my opinion, only when creating a new higher low above $8000.
– The RSI Indicator: Following the rejection of the significant 44-45 level just five days ago, the RSI is slowly losing momentum while going down. Unlike the indicator, the Stochastic RSI oscillator points bearish, as it entered the neutral territory following a crossover in the overbought area.
– Trading volume: Since November 22, the daily volume candles are declining over time. This is the ground for a coming-up price move, probably very soon.
BTC/USD BitStamp 4-Hour Chart
BTC/USD BitStamp 1-Day Chart
The post Bitcoin Price Breaks Down Towards $7000: The Indicators Anticipating a Huge Move Coming-up appeared first on CryptoPotato.