Bitcoin Price And Risk Assets Jump In Correlated Move
Bitcoin price correlates with high-beta stocks in the recent move upward. Global liquidity is increasing as financial conditions loosen.
The below is an excerpt from a recent edition of Bitcoin Magazine PRO, Bitcoin Magazine’s premium markets newsletter. To be among the first to receive these insights and other on-chain bitcoin market analysis straight to your inbox, subscribe now.
An independent bitcoin rally or a high-beta move? Either way, bitcoin holders are celebrating the latest action to start 2023. Bitcoin has shown some significant momentum and has powered through every key short-term price level across daily moving averages and on-chain realized prices. In fact, every major high-beta play in the market is showing the same strength which gives us more caution than confidence in this latest short squeeze highlighted last week in “Bitcoin Rips To $21,000, Shorts Demolished In Biggest Squeeze Since 2021.”
As much as we would like to see an independent bitcoin move higher, there’s plenty of signs in the market showing the opposite is likely. We’ve seen a relatively meaningful bounce in the most oversold names of 2022, with a short squeeze and subsequent round of FOMO off the 2022 lows.
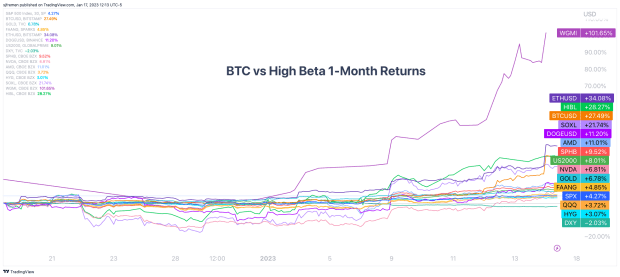
This recent risk rally has seen implied equity market volatility drift to new lows as the U.S. dollar continues to weaken over the short-term, National Financial Conditions Index (NFCI) loosens and global M2 money supply contracts at a much slower pace relative to the last few months.
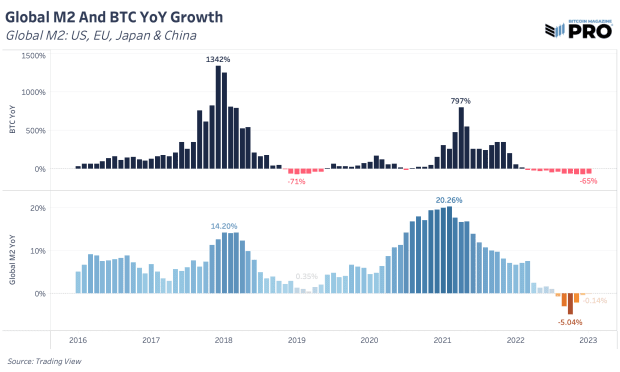
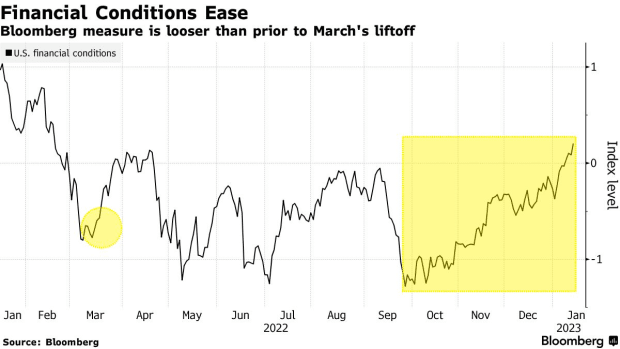
Net liquidity, a model we highlighted in our previous piece, shows a contraction compared to last year but hasn’t changed much over the last few months. If we’re to see a sustained rally continue, we’d like to see growth in net liquidity over the next couple of months to be the main driver accompanying this move.
In their recent meeting minutes, members of the Federal Reserve expressed concern about the “unwarranted easing in financial conditions” caused by the run-up in risky assets and subsequently hindering their efforts to cool inflation.
With the Bank of Japan deciding on whether to loosen their monetary policy, this could cause the carry trade to unwind. We view this to be one of the few ways where both the dollar could fall at the same time as global equity markets weaken, with equities repricing due to rising costs of U.S. capital.
Like this content? Subscribe now to receive PRO articles directly in your inbox.

Relevant Past Articles:
- On-Chain Data Shows ‘Potential Bottom’ For Bitcoin But Macro Headwinds Remain
- Liquidity, The Central Bank Balance Sheet & Bitcoin
- What To Expect When You’re Expecting Volatility
- The Fuel For Next Bull Run
- Bitcoin Short Sellers Get Squeezed
- Caution: Bear Market Rallies
- When Will The Bear Market End?


