Bitcoin Price Analysis: Where is The Next Critical Support Following Today’s BTC Plunge?
Bitcoin dropped by a sharp 6% today as the cryptocurrency retraced from $60K beneath $55,000 to reach as low as $54,557 on Bitstamp (.382 Fib) as of writing these lines.
Prior to today’s price drop, Bitcoin concluded another bullish week in which it bounced from $56,110 to reach a new all-time high price at $61,780, which was recorded on Saturday.
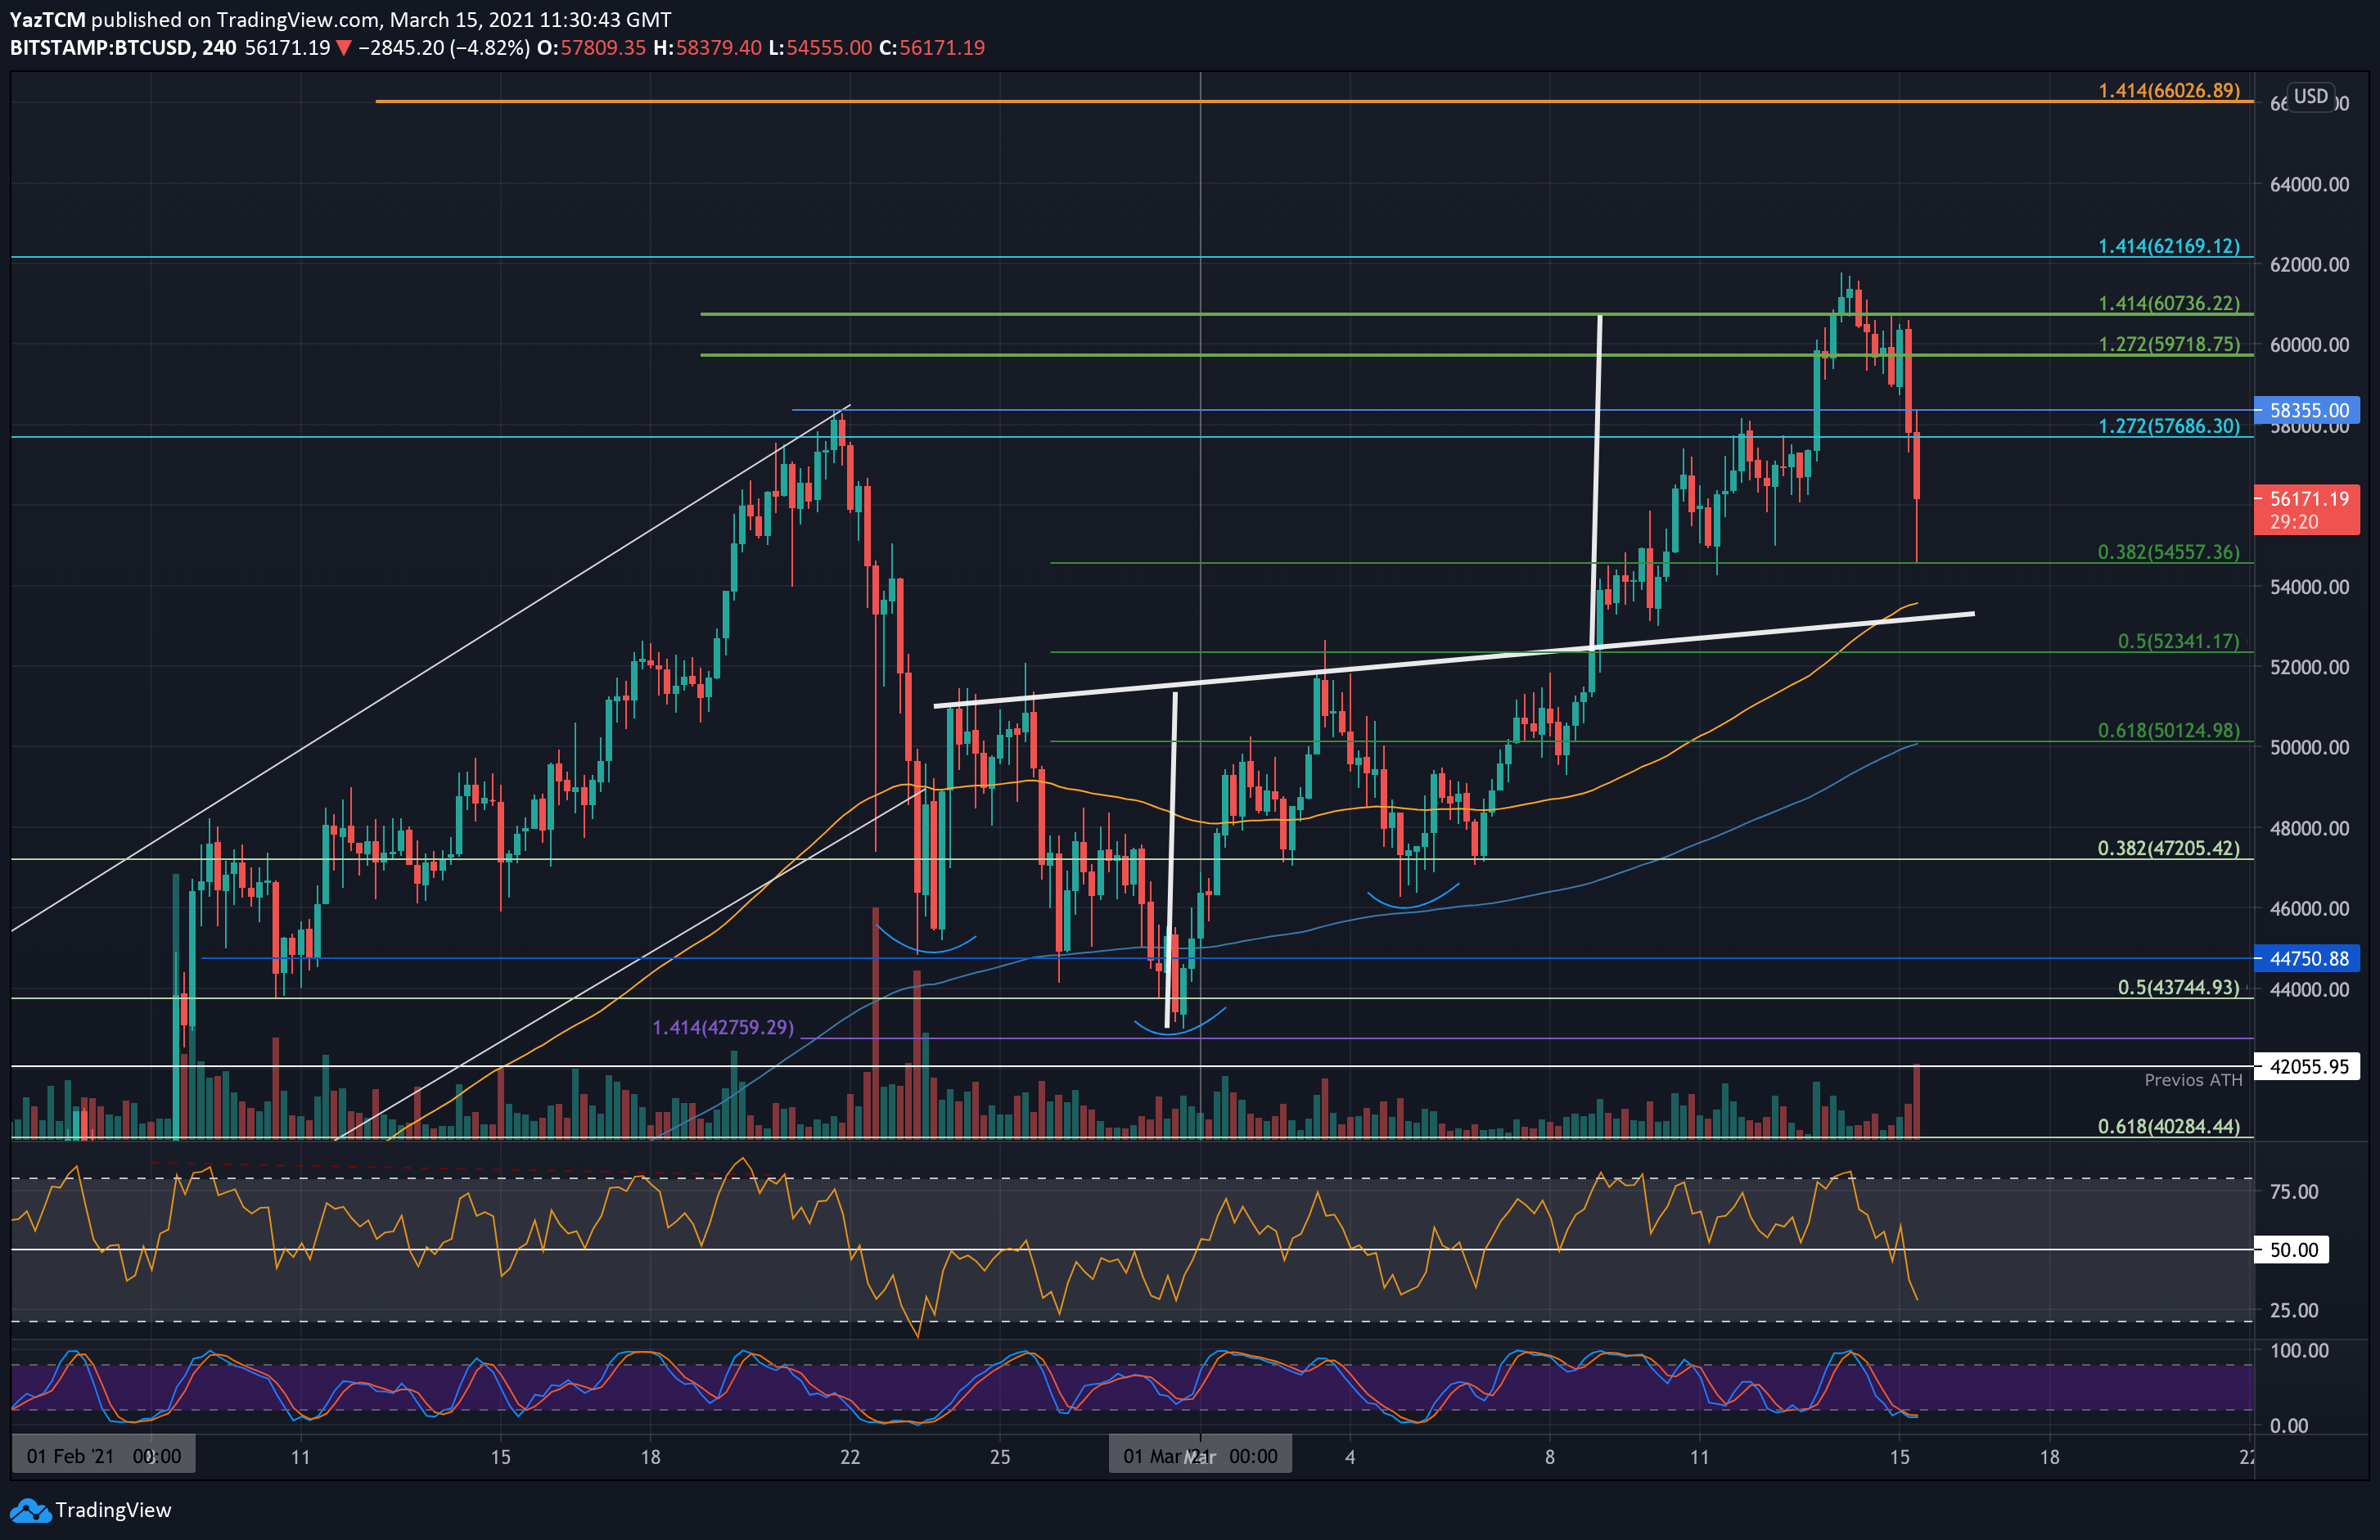
Simultaneously, as shown on the short-term 4-hour chart, Bitcoin had managed to break above the neckline of an inverse head & shoulders pattern at around $52,500. The breakout handed a price target of $60.7K, which was fully reached.
There, it reached resistance at the upper boundary of a narrow ascending price channel, and over the past 48-hours, BTC lost more than $6000 of its value (as of now).
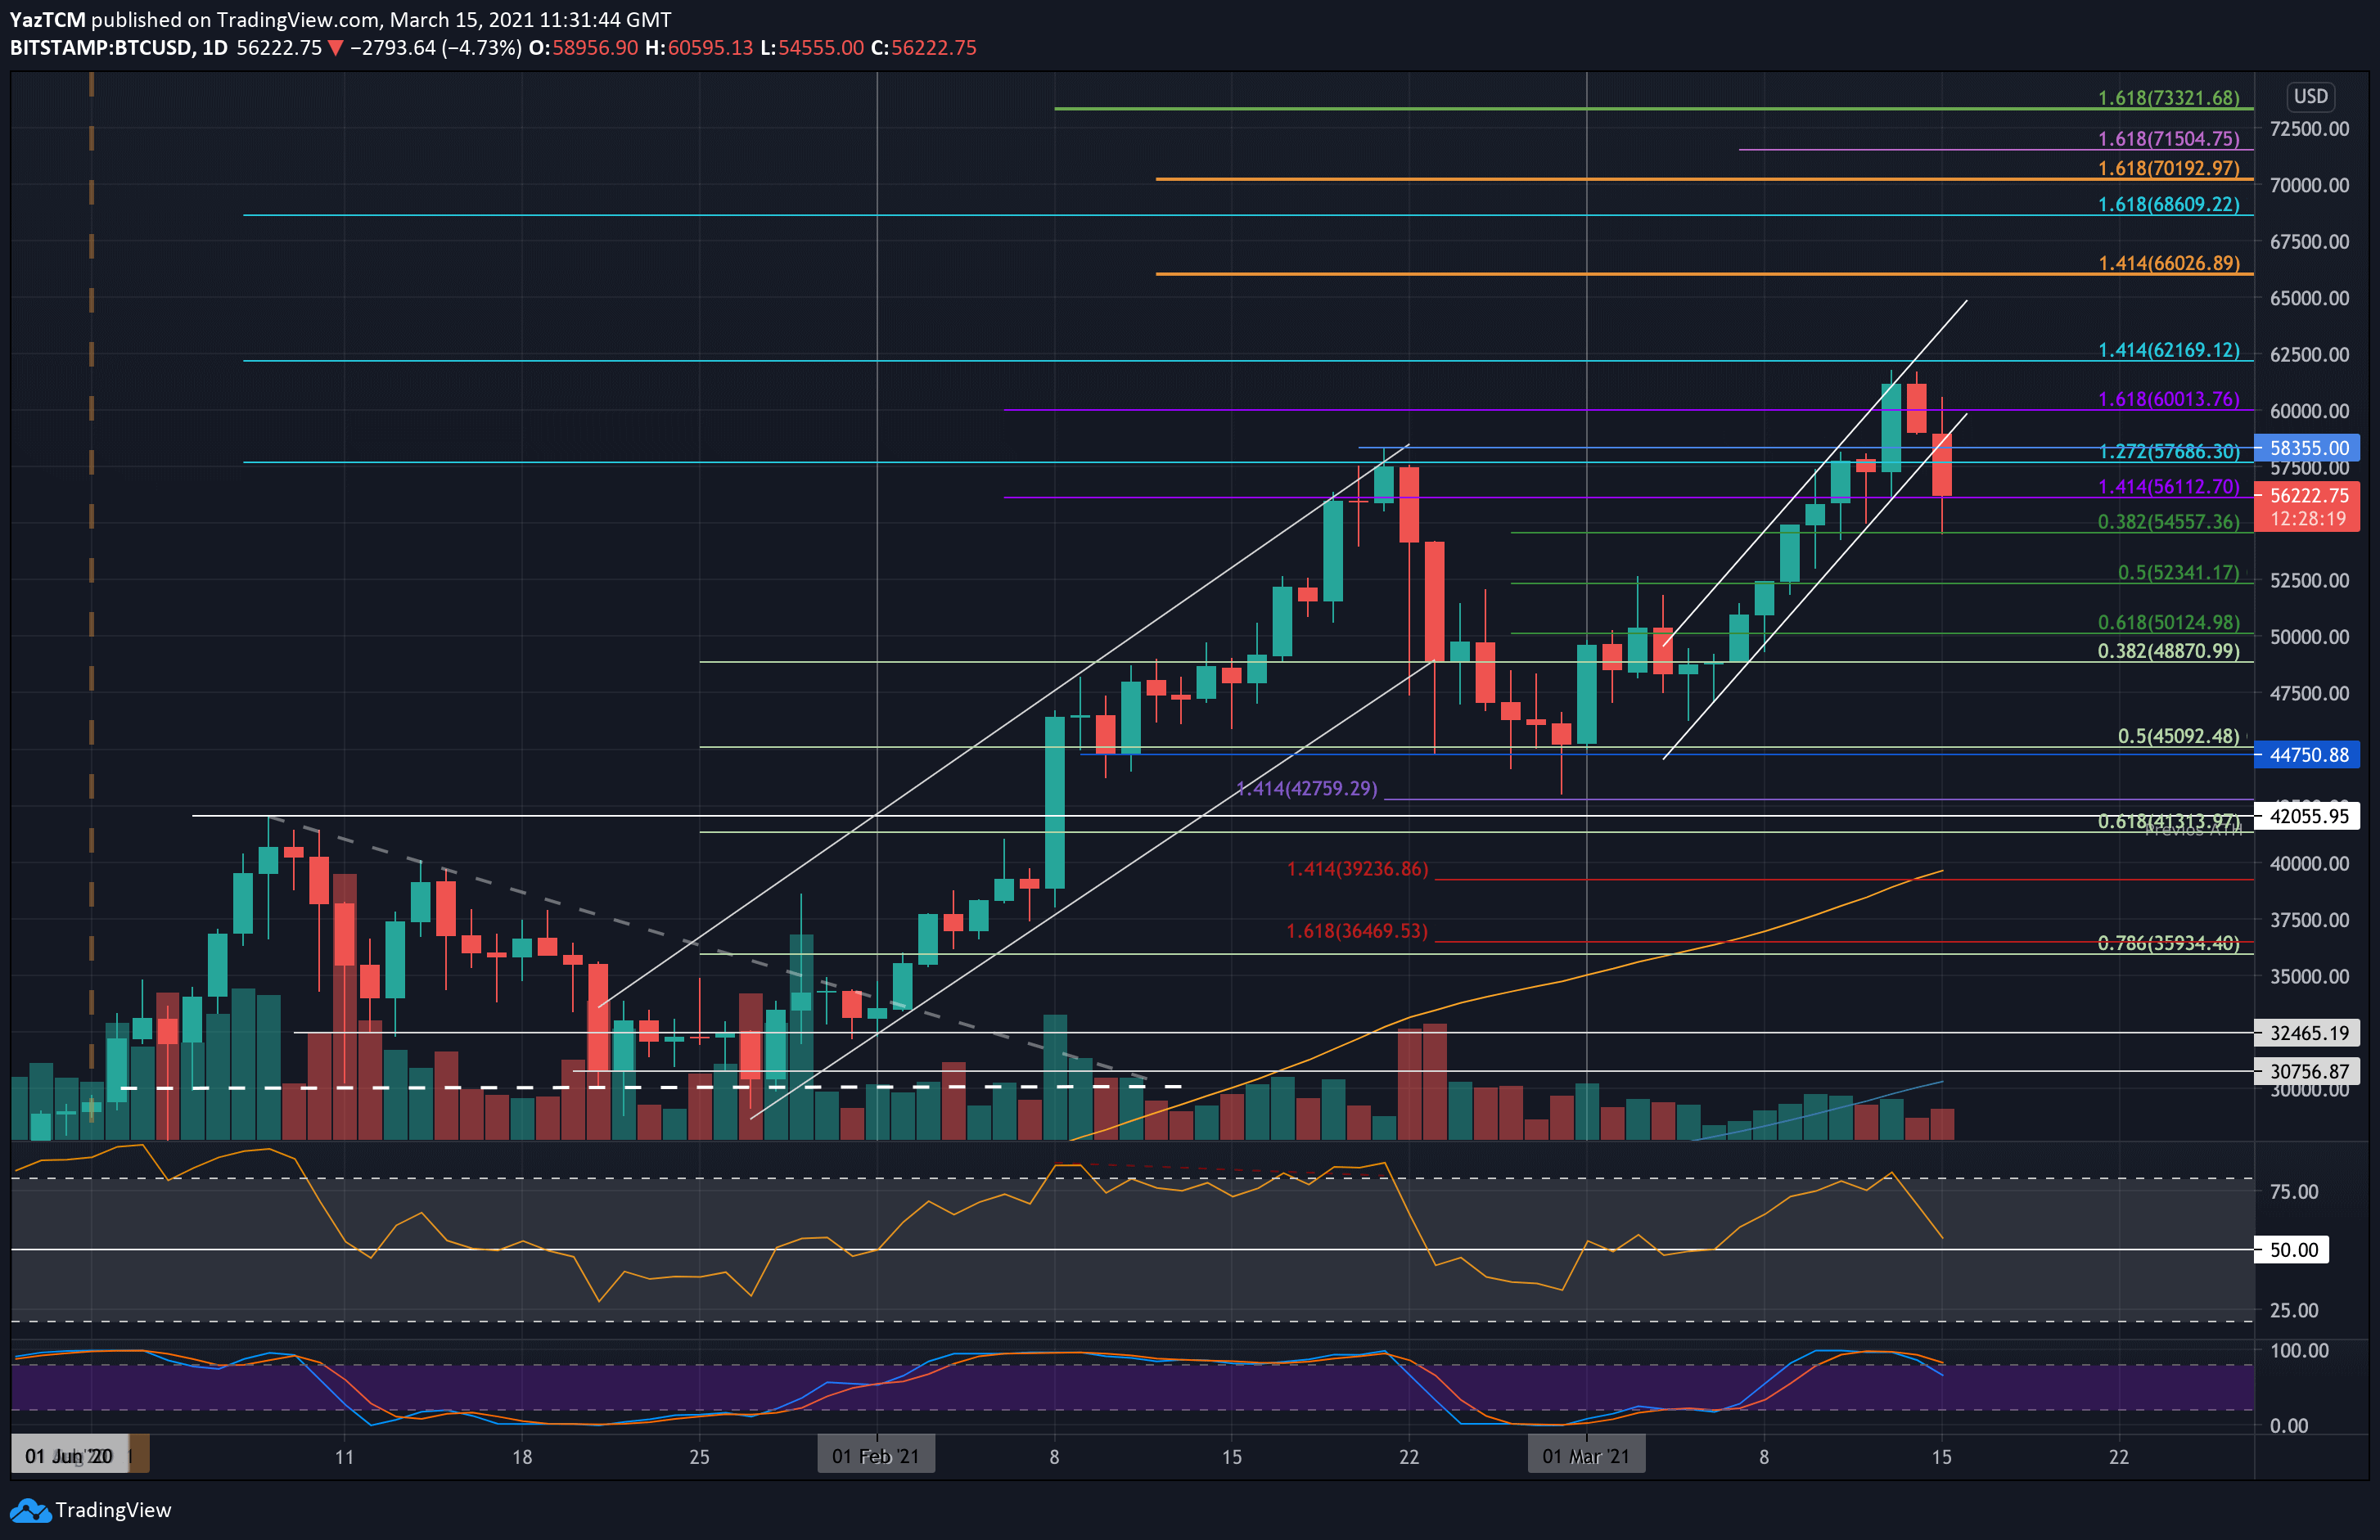
Today’s sharp price drop generated a breakdown of the ascending price channel, as shown on the following daily chart (confirmation only at the end of today’s daily candle – midnight UTC).
The question is whether Bitcoin will plunge further than the healthy 0.382 Fib level correction ($54.5K). If so, the mentioned above neckline will be the next critical level of support for the buyers to defend.
BTC Price Support and Resistance Levels to Watch
Key Support Levels: $56,110, $54,500, $53K – $52,340, $50,125 – $50,000, $48,870.
Key Resistance Levels: $58,355, $60,000, $61,780, $62,170, $65,00.
Looking ahead, the first level of support lies around today’s low of $54,500 (.382 Fib level), followed by $53K – $52,340 (.5 Fib and the neckline), $50K – $50,125 (.618 Fib), $50,000, and $48,870 (long-term .382 Fib).
On the other side, the first level of resistance lies at $58,355 (previous ATH). This is followed by $60,000, $61,780 (ATH price), $62,170 (1.414 Fib Extension), and $65,000.
The daily RSI dipped heavily from overbought conditions as it approaches the midline, indicating the previous bullish momentum has dissipated (on the short-term charts). If it continues to break beneath the 50 level, the bearish momentum will increase and is likely to force BTC into further lower targets.
Bitstamp BTC/USD Daily Chart
Bitstamp BTC/USD 4-Hour Chart