Bitcoin Price Analysis: Where Is Bitcoin Heading Now, Following The Recent Price Breakdown?
Just a quick weekend update for Bitcoin price following the break-down of the triangle we had pointed out two days ago, along with the significant key-support area of the 200-days moving average line.
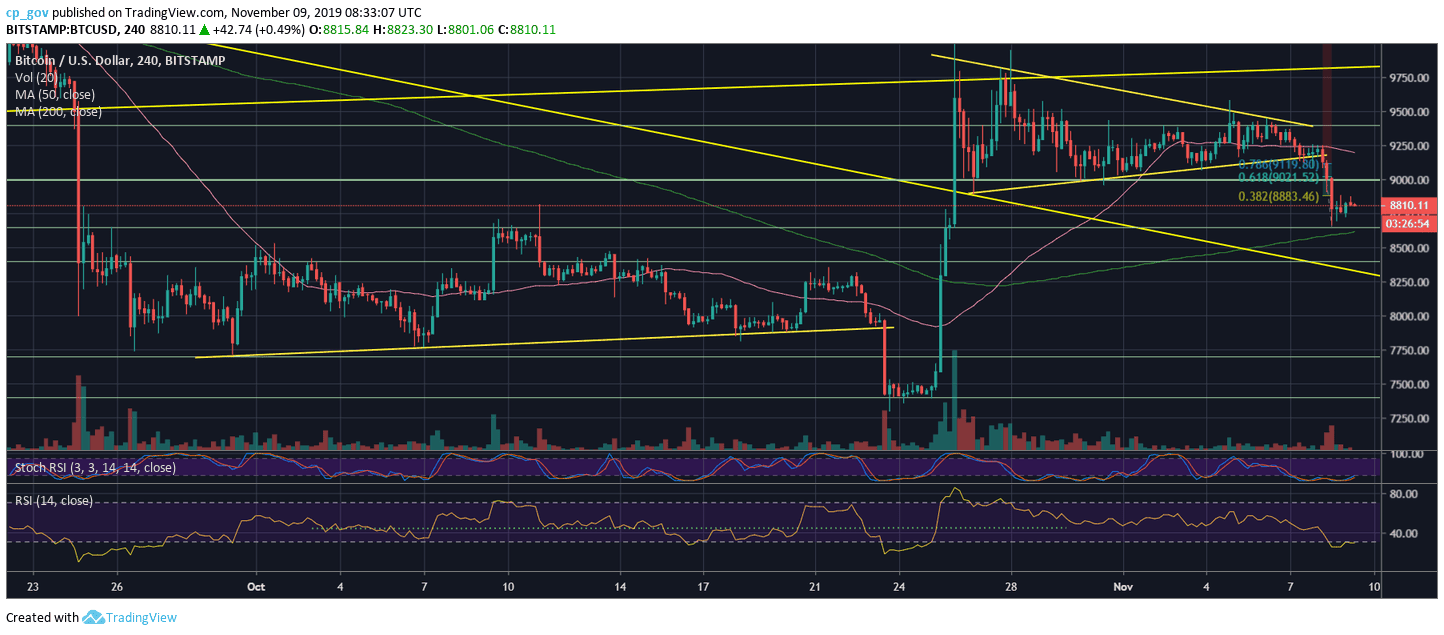
Two days ago, I warned here that Bitcoin is at short-term risk. As can be seen, Bitcoin didn’t hold support for the fifth time, and violently broke down. This resulted in a 48-hours $800 drop. On the following charts, you can see the moment BTC broke down roughly at $9150, followed by substantial red candles, quickly down to $8660.
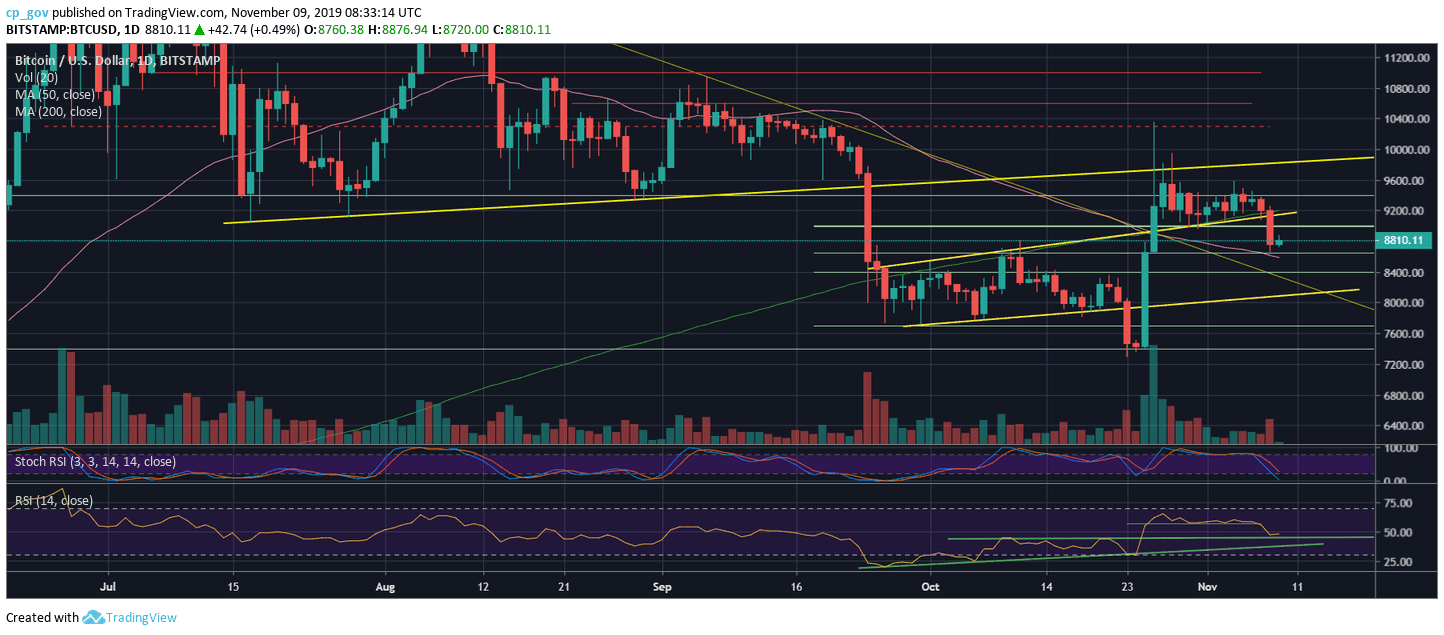
As can be seen on the daily chart, this target is not a coincidence. The support area, that was marked by us on the weekly market update analysis, also contains the 50-days moving average line (marked pink on the daily chart).
After finding support, we saw a slight correction back to the 38.2% Fibonacci retracement level, marked on the 4-hour chart, at $8883. In my opinion, the correction can also reach $9000 – $9100 (Fibonacci levels 61.8% and 78.6%), but as of now, this doesn’t look the best for Bitcoin.
Total Market Cap: $240 billion
Bitcoin Market Cap: $159.5 billion
BTC Dominance Index: 66.4%
*Data by CoinGecko
Key Levels to Watch
– Support/Resistance: As mentioned above, Bitcoin is now under correction, where the first level of resistance is the $8883 38.2% Fib level, before reaching the $9000 – $9100 area. Further above is the $9200 level (along with the 200-days moving average line); this is followed by the strong resistance area at $9400 – $9500.
From below, the first support lies at yesterday’s low $8660, along with the 50-days MA at $8600. Further below lies $8400 and the ascending trend-line (currently around $8200).
The RSI Indicator: The daily RSI broke down the 57-horizontal support, which held the price nicely for almost ten days. As of now, the RSI found support on a past resistance level of 44. Stochastic RSI oscillator is paving its way to the oversold territory, but there is still more room to go on the downside, according to the oscillator.
Trading volume: Following the price action, the volume spiked to a 10-days high, after declining from day to day over the past two weeks.
BTC/USD BitStamp 4-Hour Chart
BTC/USD BitStamp 1-Day Chart
The post Bitcoin Price Analysis: Where Is Bitcoin Heading Now, Following The Recent Price Breakdown? appeared first on CryptoPotato.