Bitcoin Price Analysis: Volatility Expected Amid Dec-31 BTC Options Expiration
Amid the last days of 2021, Bitcoin is struggling around the $50K price area. The primary cryptocurrency is facing a huge options expiration event on the last day of 2021; hence, the next days are expected to be volatile.
Option Market Analysis
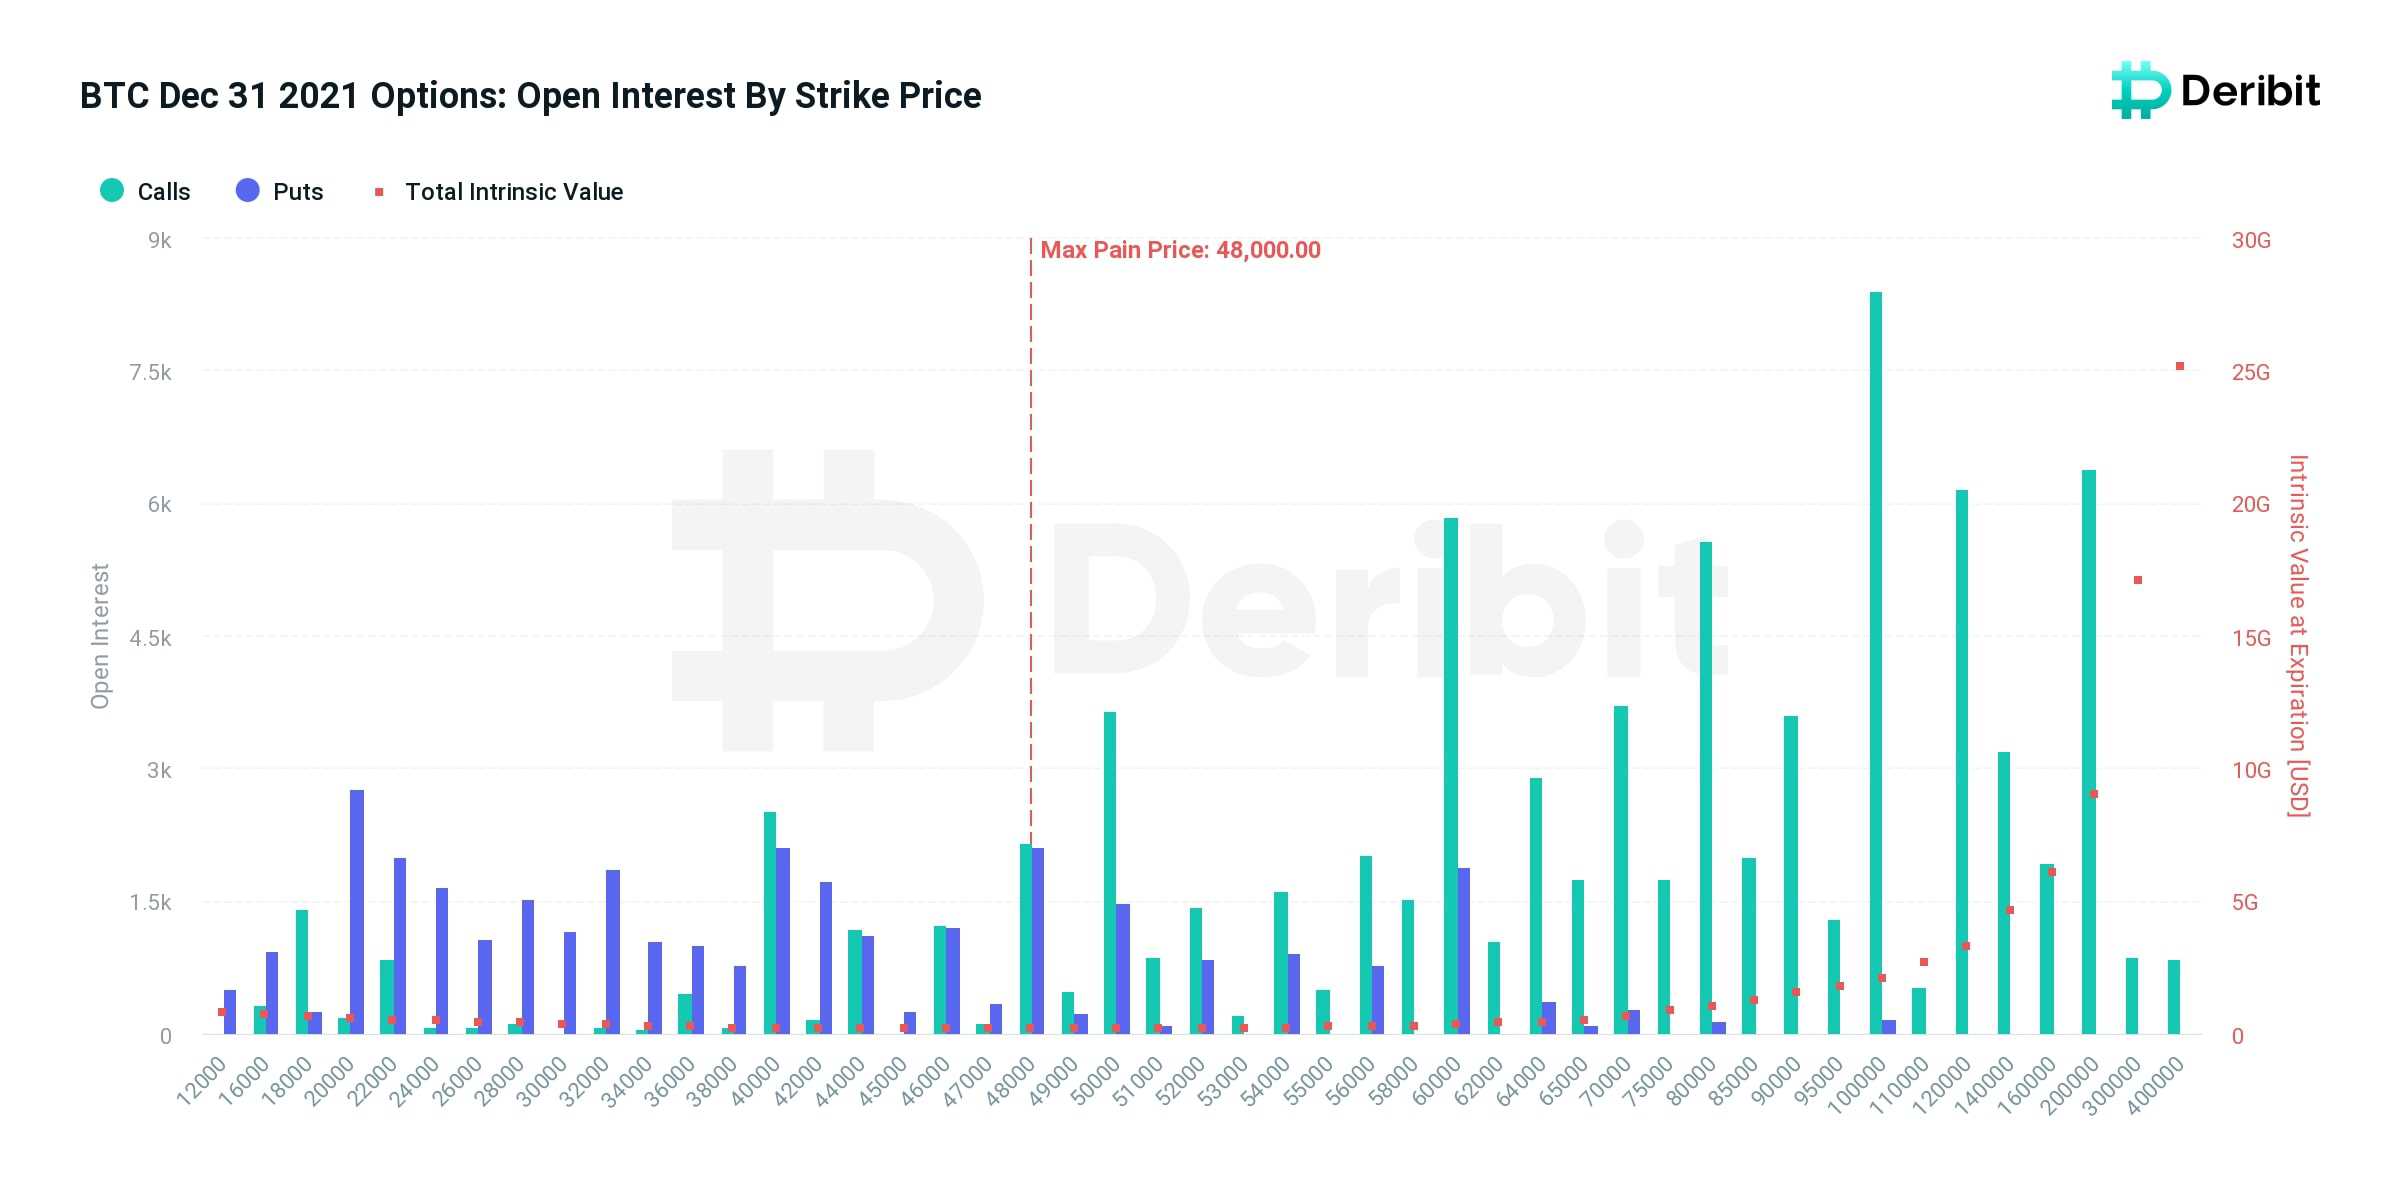
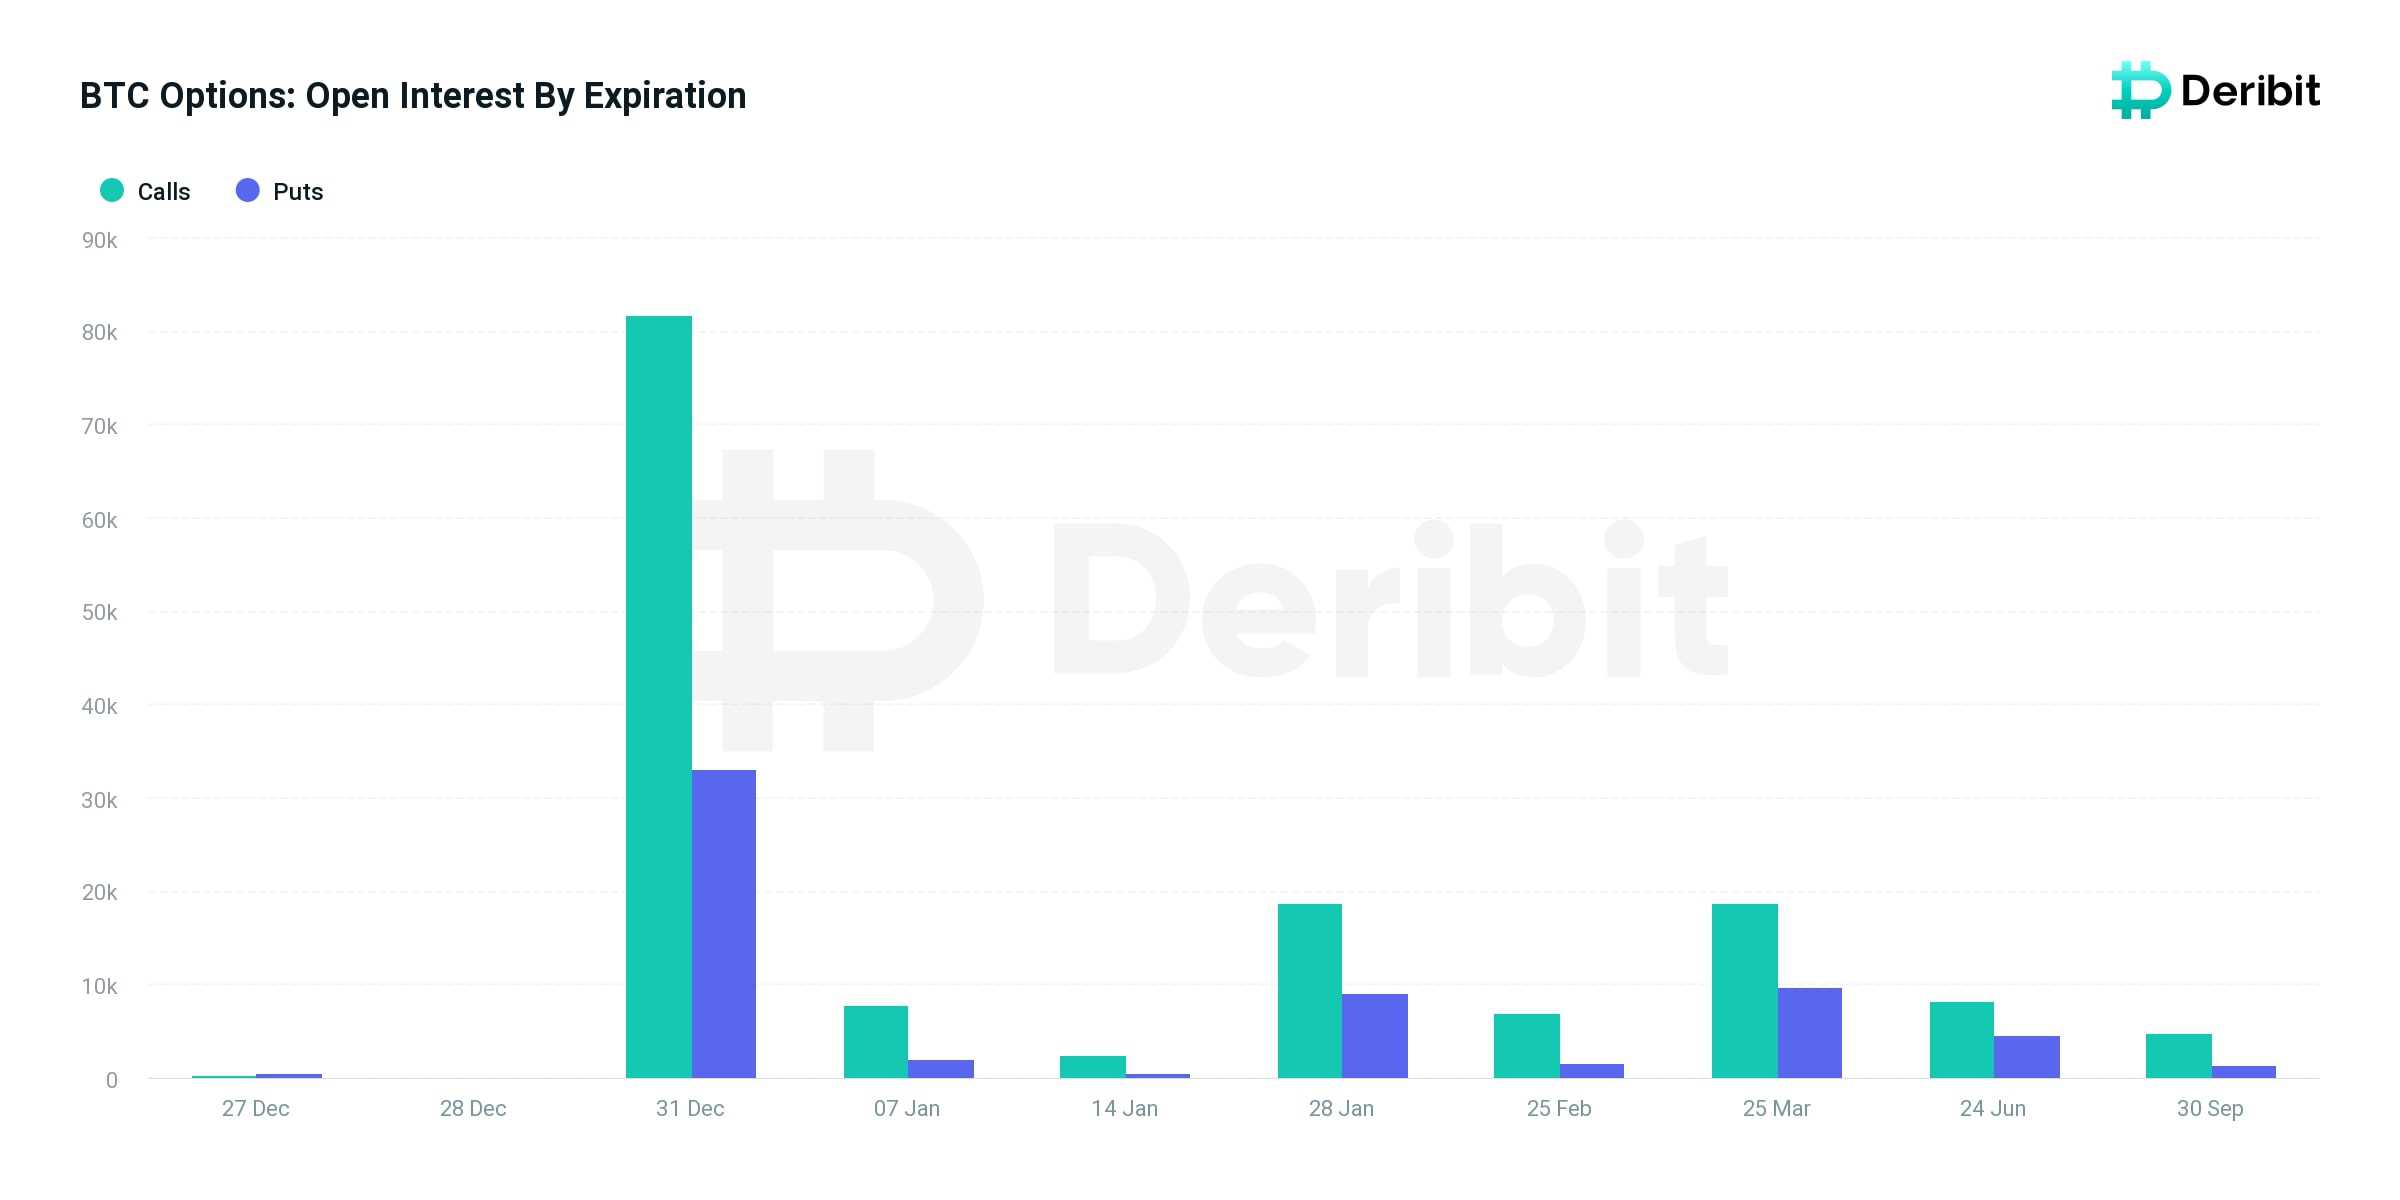
This Friday, 31st December, about $5.7 B worth of bitcoin’ options contracts will expire on Deribit Exchange.
The notional value of all expirations is approximately $10.7B. So comparing to 31 DEC‘s notional value, we can call it a massive expiry. The ‘max pain’ price is $48k. Moreover, the Call sellers for the $58k & $60k strike prices are not optimistic about a possible end-of-the-year Santa rally. Therefore, a high level of volatility is expected in the market in the coming days.
Technical Analysis
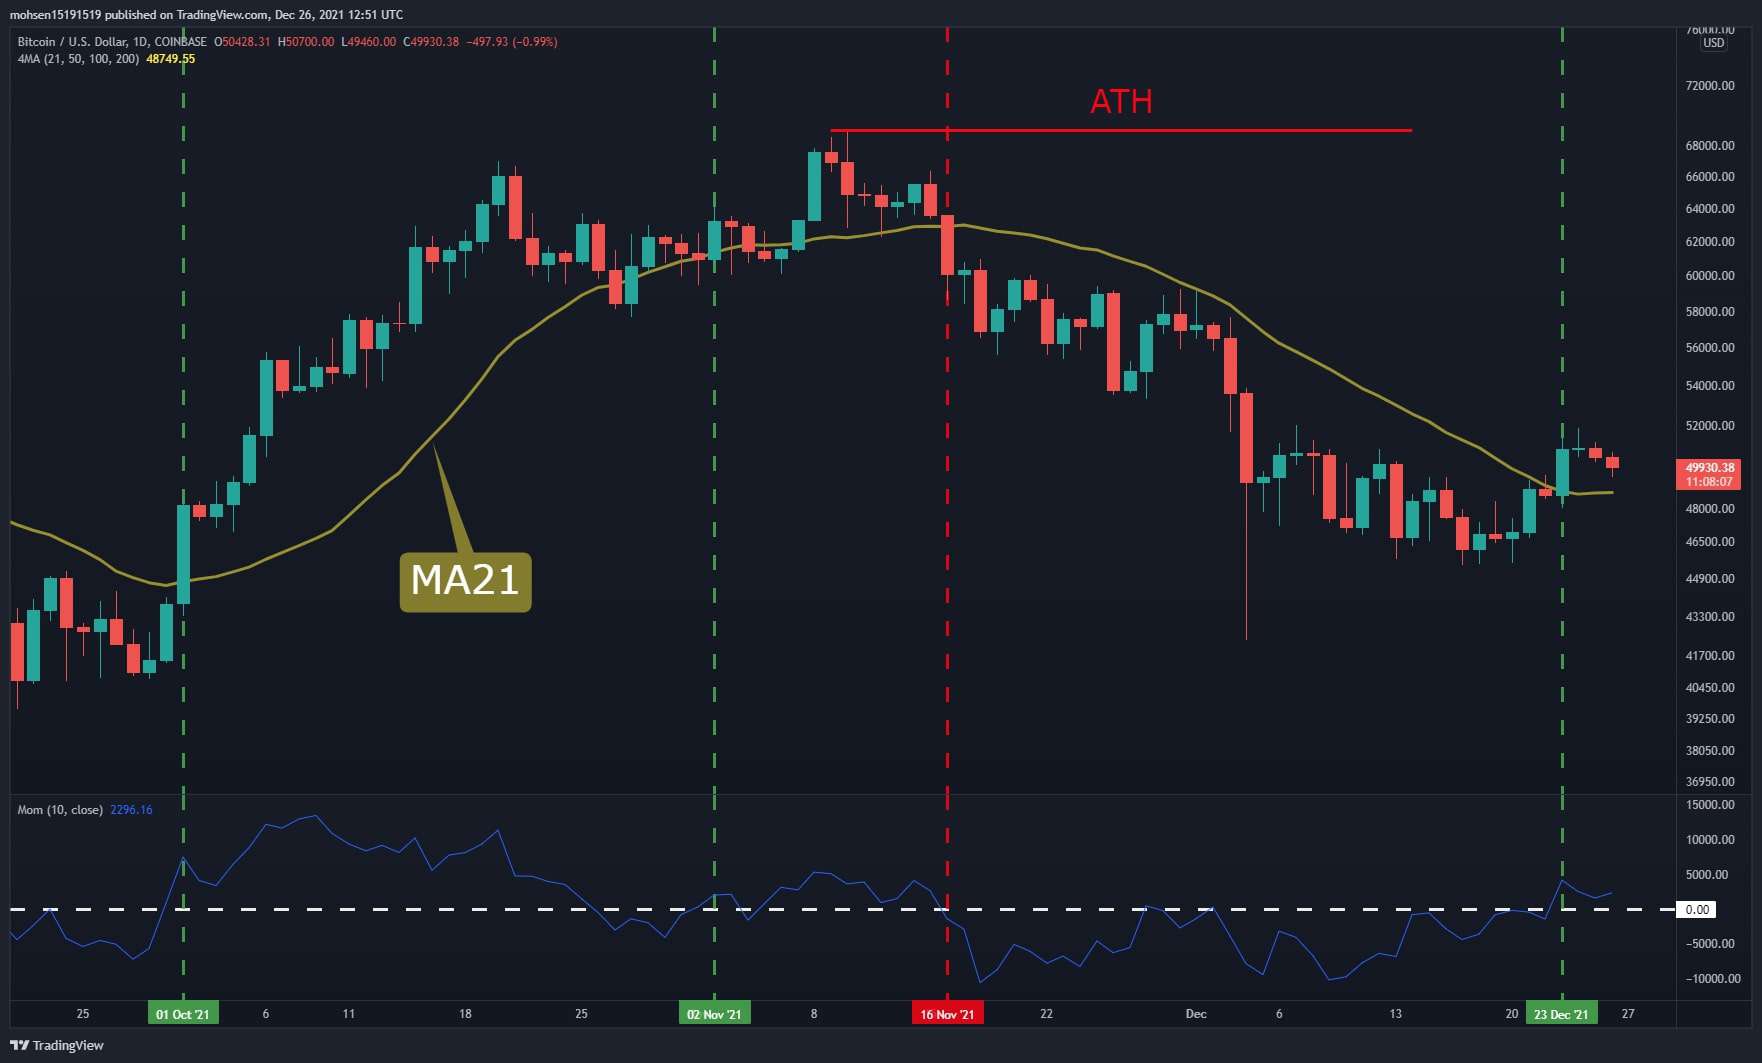
Following the recent drop from the ATH set in November, bitcoin broke above the MA-21 line by a 14% daily candle this week.
The Momentum indicator is above the zero-baseline, which could signify that the bulls are gradually stepping back into the market.
Short-Term Technical Analysis: The 1-Hour Chart
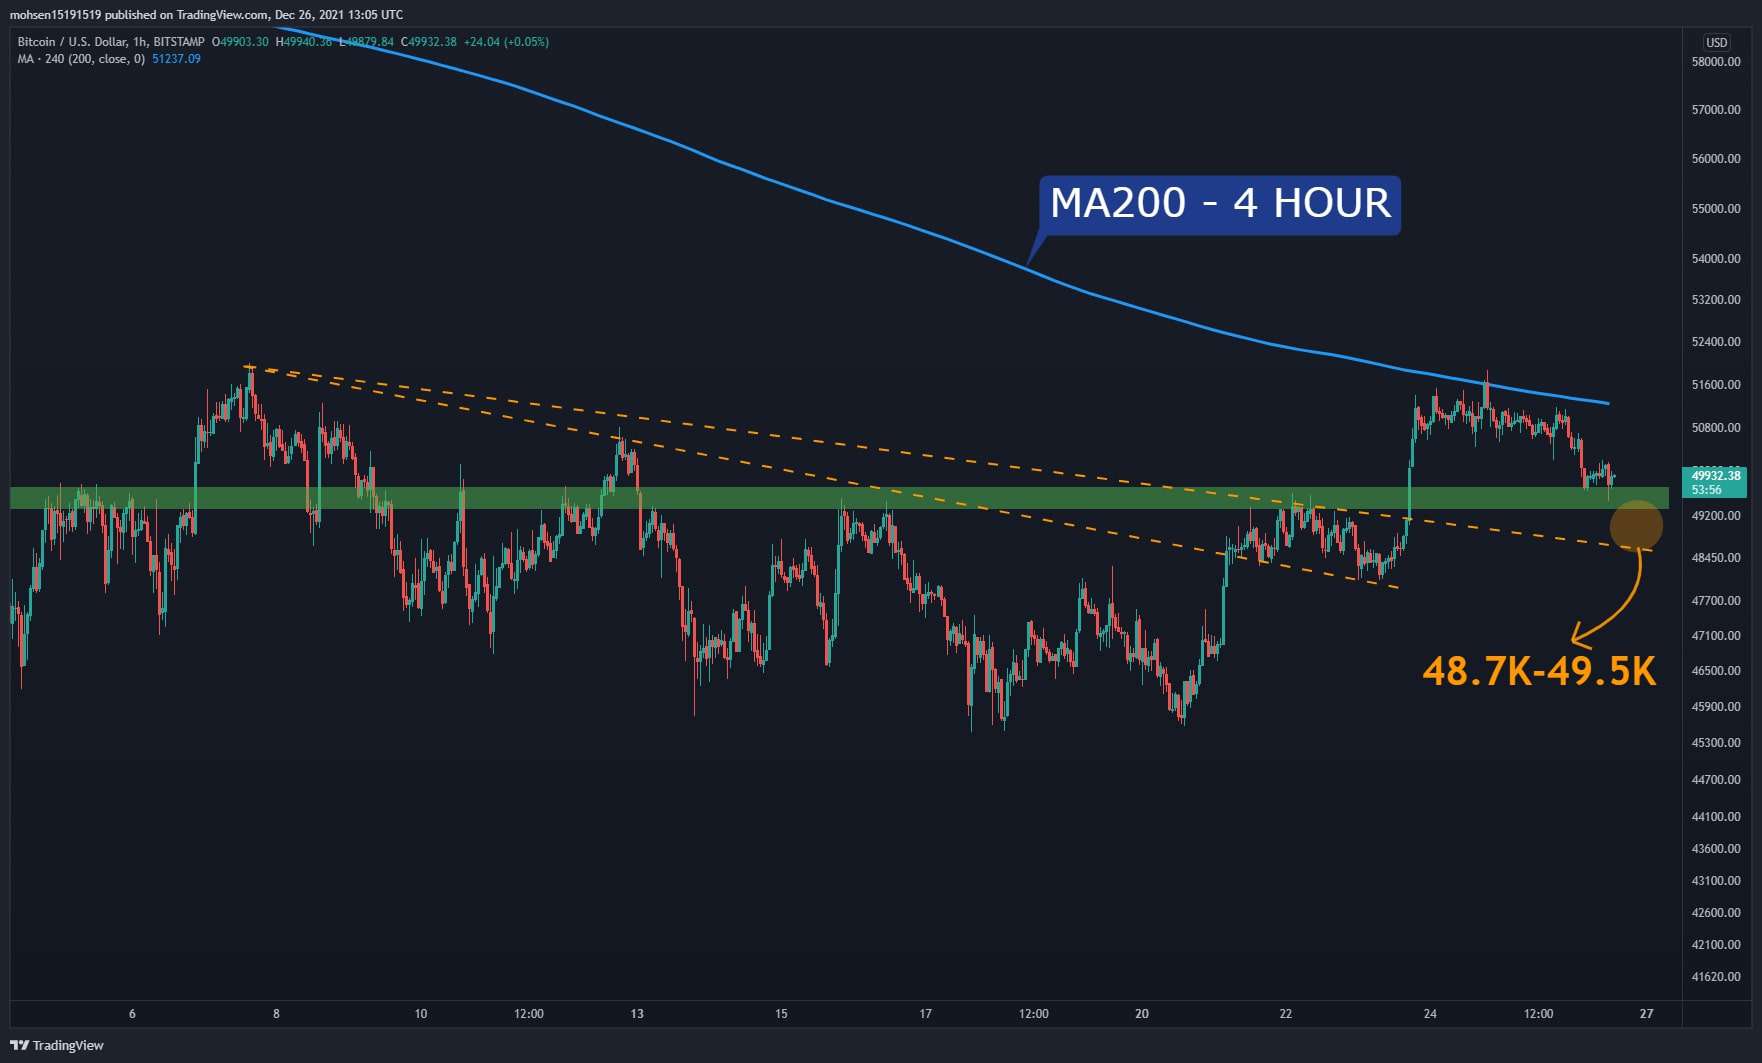
Following its recent daily uptrend, the BTC price is now retesting the most recent short-term support levels on the lower timeframe.
After getting rejected by the MA200 line on the 4-hour timeframe, the price is expected to find support at the static zone (marked by green area), which has played an essential role since hitting $42K. Any drop towards the $48.7K – $49.5K levels (yellow circle) will be considered a healthy correction to gain the required momentum before continuing the price recovery.
Onchain Analysis
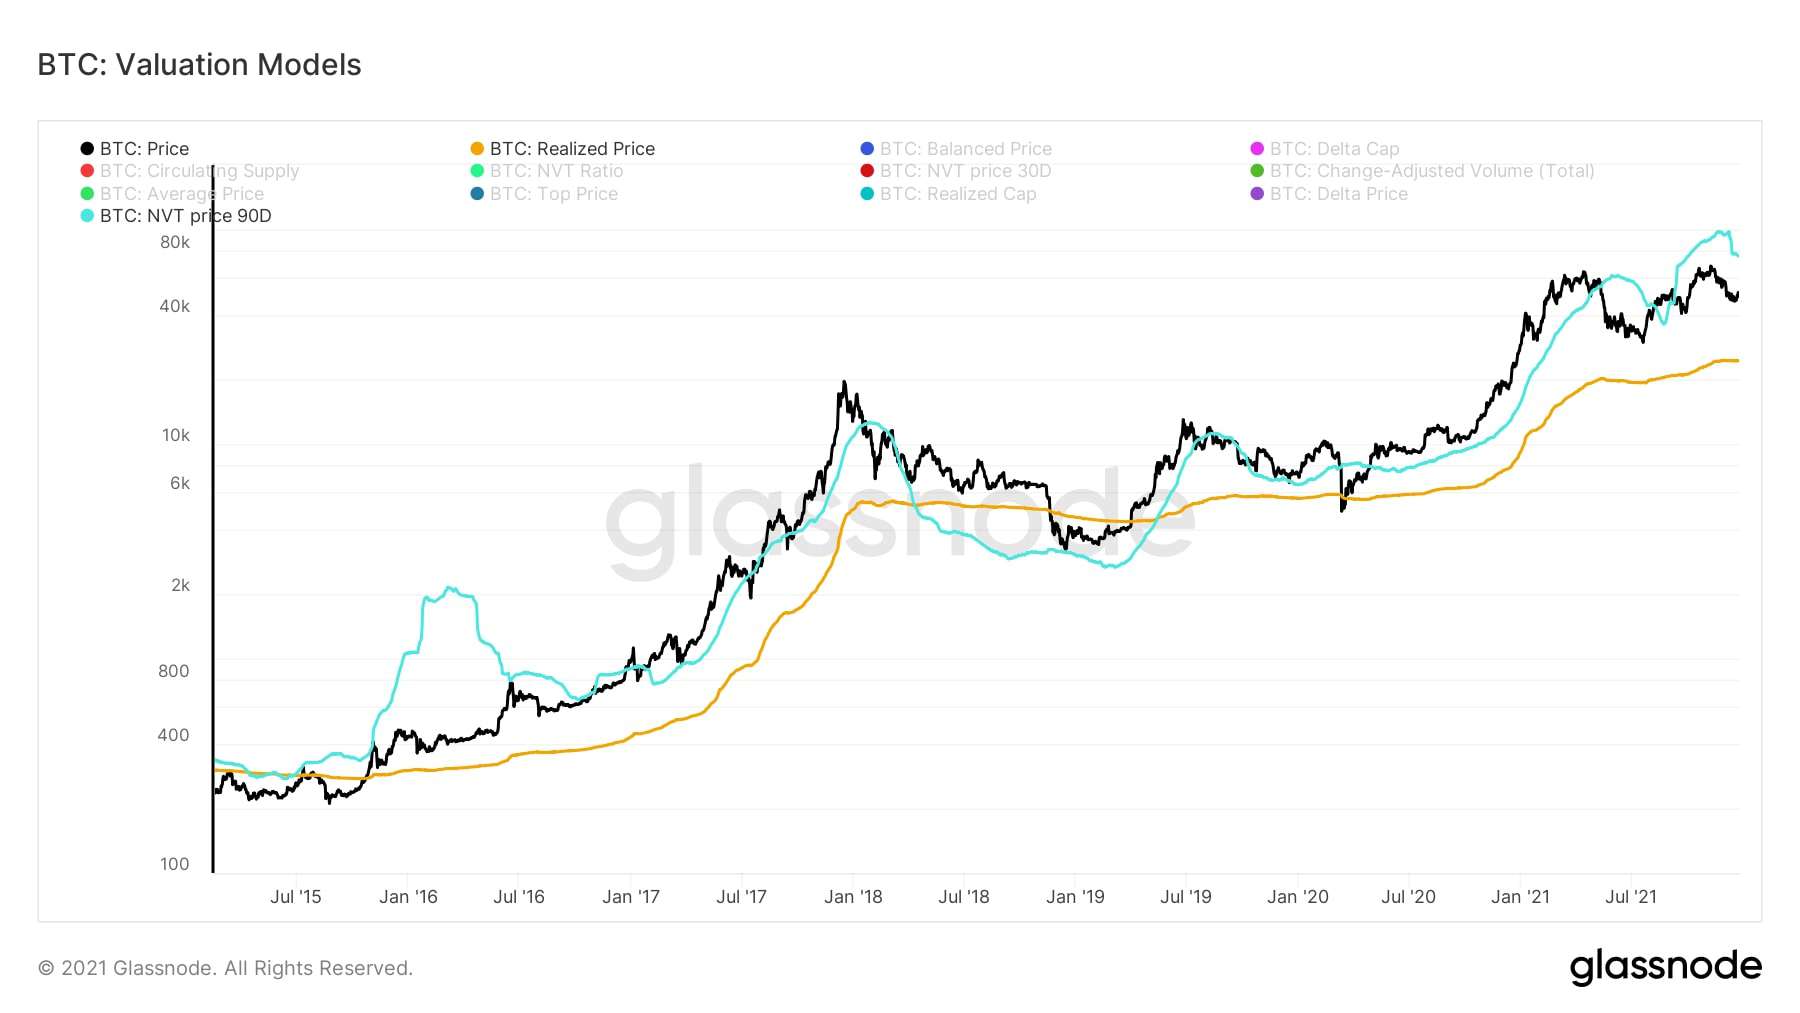
The NVT Ratio values the Bitcoin network using the investor volume as seen on the blockchain. NVT Ratio is the ratio of on-chain volume to its market cap, something like a PE Ratio.
The NVT price level has been a useful BUY/SELL indicator for mid-term investors. Historically, whenever market price remained below the NVT price for an extended timeframe, later it had proven to be a great chance to accumulate more Bitcoin.
The above analysis was complied by analysts @GrizzlyBTClover, @N__E__D__A, and @CryptoVizArt exclusively for CryptoPotato.


