Bitcoin Price Analysis: Time For Correction or Time for $12,000?
So far so good: Bitcoin is breathing highs over the past two days since our recent analysis, trading just below $11,000.
As stated here before, Bitcoin price is very unexpected. There was no analyst out there which could declare that Bitcoin’s bottom was indeed the $3,000 area, back in December 2018. And no analyst could expect that before mid-2019, the primary cryptocurrency would return to a 5-digit number.
However, there is always a bearish aspect. As we have learned from its short history, when Bitcoin spikes parabolically, we can expect a sharp move to the other side.
Just like happened after losing more than 80% of its value during 2018, Bitcoin produced the current price spike to the bullish side in the first months of 2019.
Two Directions – Two Thoughts
As of writing this, Bitcoin looks perfect for continuing higher. However, the bulls wouldn’t regret to see a healthy correction soon.
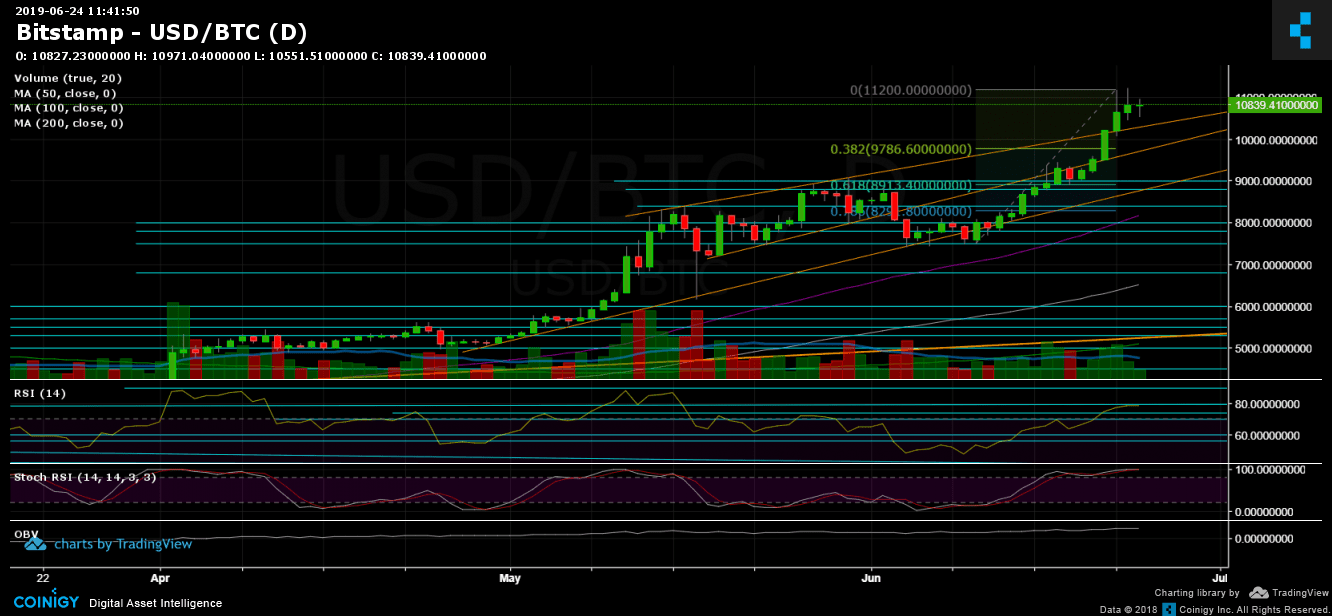
As can be seen on the daily chart, the bullish move from $7500 to the recent 2019 high at $11,200, hadn’t gone through a significant correction.
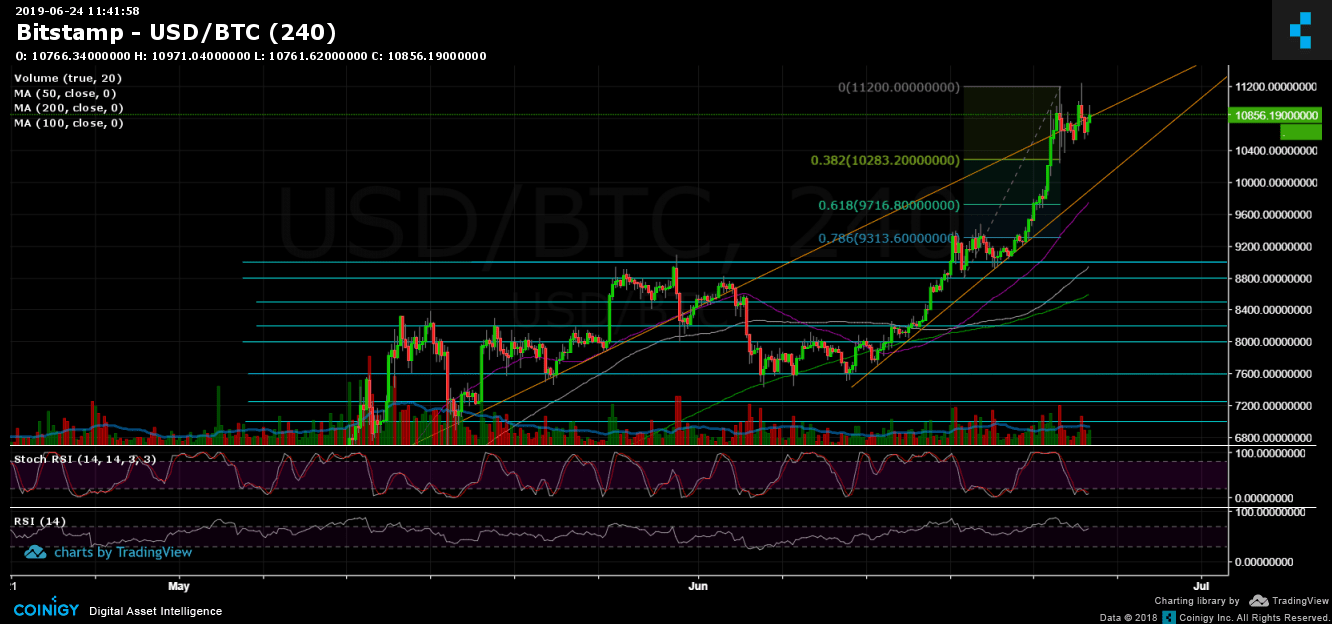
Right now, there are two scenarios in my opinion: The first, Bitcoin formed a double-top pattern, around the high of $11,200 (can be seen on the 4-hour chart). A double top is a bearish formation that leads to the necessary correction. This is supported by the following two significant measurements that reached resistance levels: Bitcoin’s market cap ($200B) and BTC dominance (60%).
The second scenario is breaking above the current high around $11,200, followed by a decent amount of volume, to continue this impressive bull-run.
Total Market Cap: $326.5 Billion
Bitcoin Market Cap: $193.3 Billion – very close to the $200 Billion market cap. The 2019 high stands at $198. Watch closely.
BTC Dominance: 59.2% – Very close to the 60% resistance on the dominance chart.
Looking at the 1-day & 4-hour charts
– Support/Resistance:
In case a correction will take place shortly, then we would expect those levels to be considered as a healthy correction: $10,300 (Fib retracement level 38.2%, 4-hour chart, this is also Bitcoin’s current low after breaching $11K for the first time), $9,800 (Fib retracement level 38.2%, 1-day chart) and $9400 which is the prior high. Below $9,400 the bullish momentum can get delayed a bit.
From the bullish side, in case BTC manages to overcome current high’s area around $11,200, then the next significant resistance area would be around $11,500 – $11,600, which is the high from February 2018. Further above lies the $12,000. Above $12,00 and the move can get out of control. We remind how quickly Bitcoin captured $20,000 back in 2017 following the breakout of $12,000.
– Daily chart’s RSI: The RSI also broke out above 70 and still facing the 80 level for the past three days. So far, the RSI proves bullishness. However, one concern is the divergence in the RSI, both daily and weekly charts. To see the bullish momentum, continue, the RSI needs to follow Bitcoin’s price chart in creating higher highs.
Another thing to note is that Stochastic RSI of the daily chart is stretched out to the overbought area.
– Trading Volume: Yesterday volume was huge, even though it was the weekend. The buyers have returned. It will be interesting to see whether a correction will be followed by a lower volume of sellers (healthy) or a breakout will break the current volume records.
– BitFinex open short positions: The open short positions are gaining momentum along with the rising Bitcoin. There are now 29.1 K BTC of open short positions. This is their highest level since May 11.
BTC/USD BitStamp 4-Hour Chart
BTC/USD BitStamp 1-Day Chart
The post Bitcoin Price Analysis: Time For Correction or Time for $12,000? appeared first on CryptoPotato.