Bitcoin Price Analysis: The Reason Behind BTC’s Crash to $60K Today
Bitcoin’s price is currently trending down as a result of the potential war brewing in the Middle East. A key level is lost, which could lead to a further decline in the short term.
Technical Analysis
By Edris Derakhshi (TradingRage)
The Daily Chart
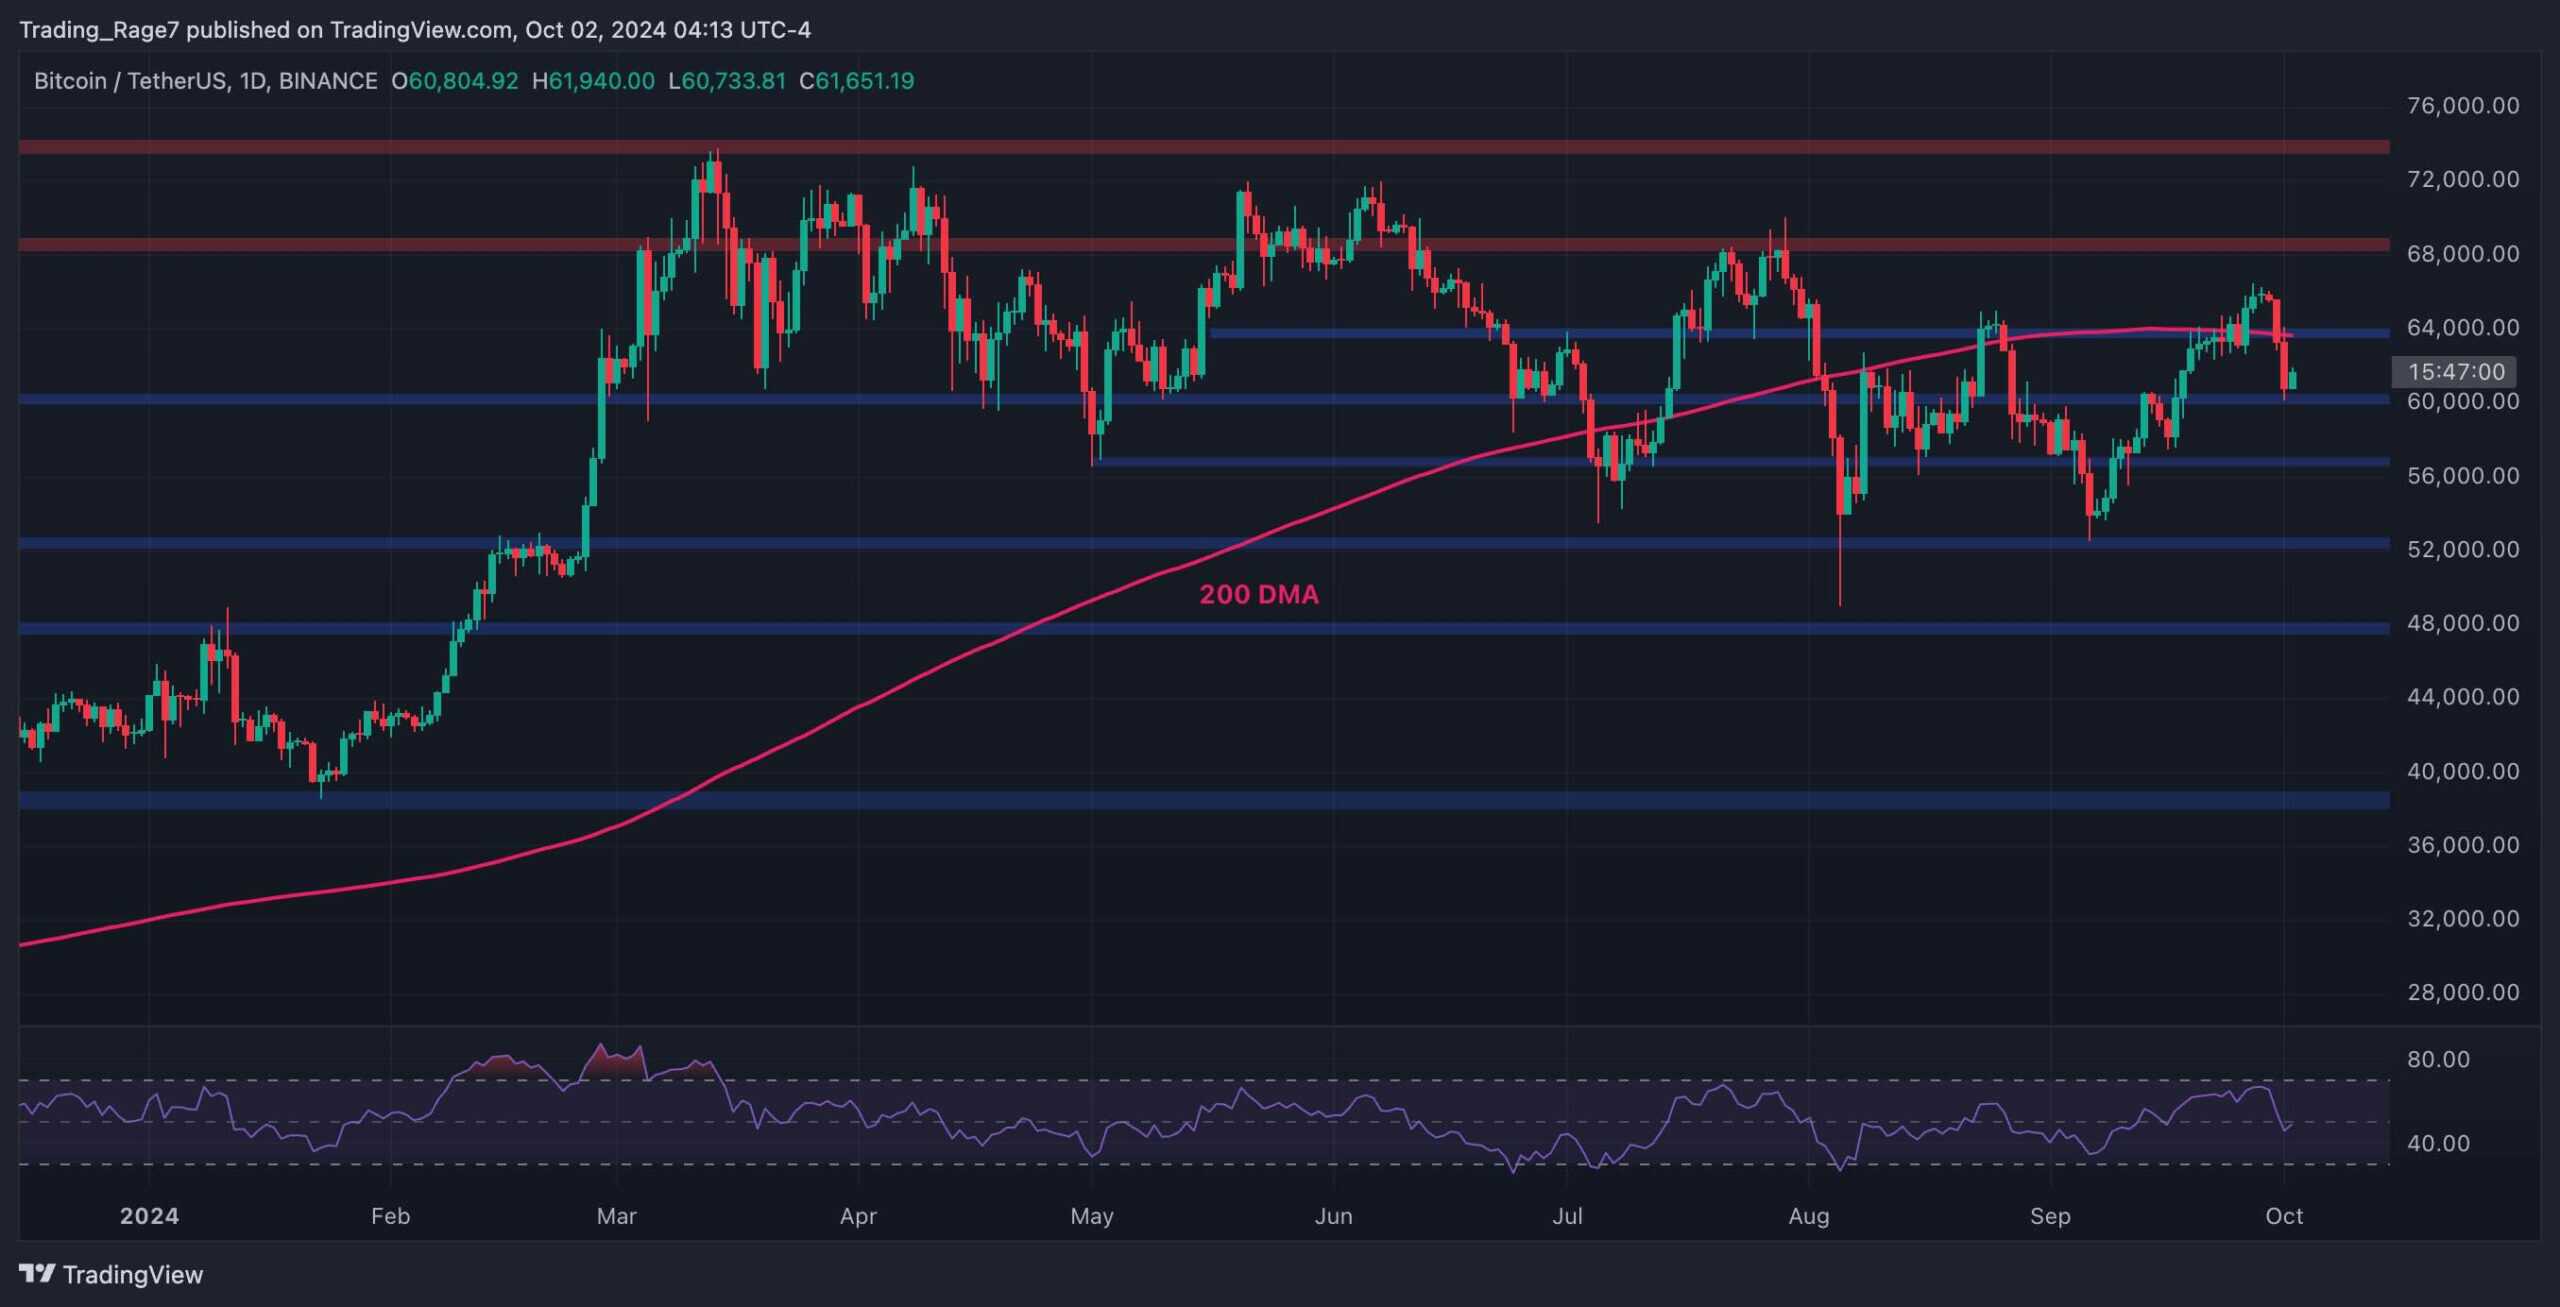
In the daily timeframe, the BTC price dropped below the key $64K mark and the 200-day moving average, which is located around the same price mark. Currently, the $60K support level remains intact, as investors remain hopeful that this decline is a temporary pullback.
However, with the RSI also showing values slightly below 50%, the momentum is shifting bearish, and a move lower toward $56K remains a possibility.
The 4-Hour Chart
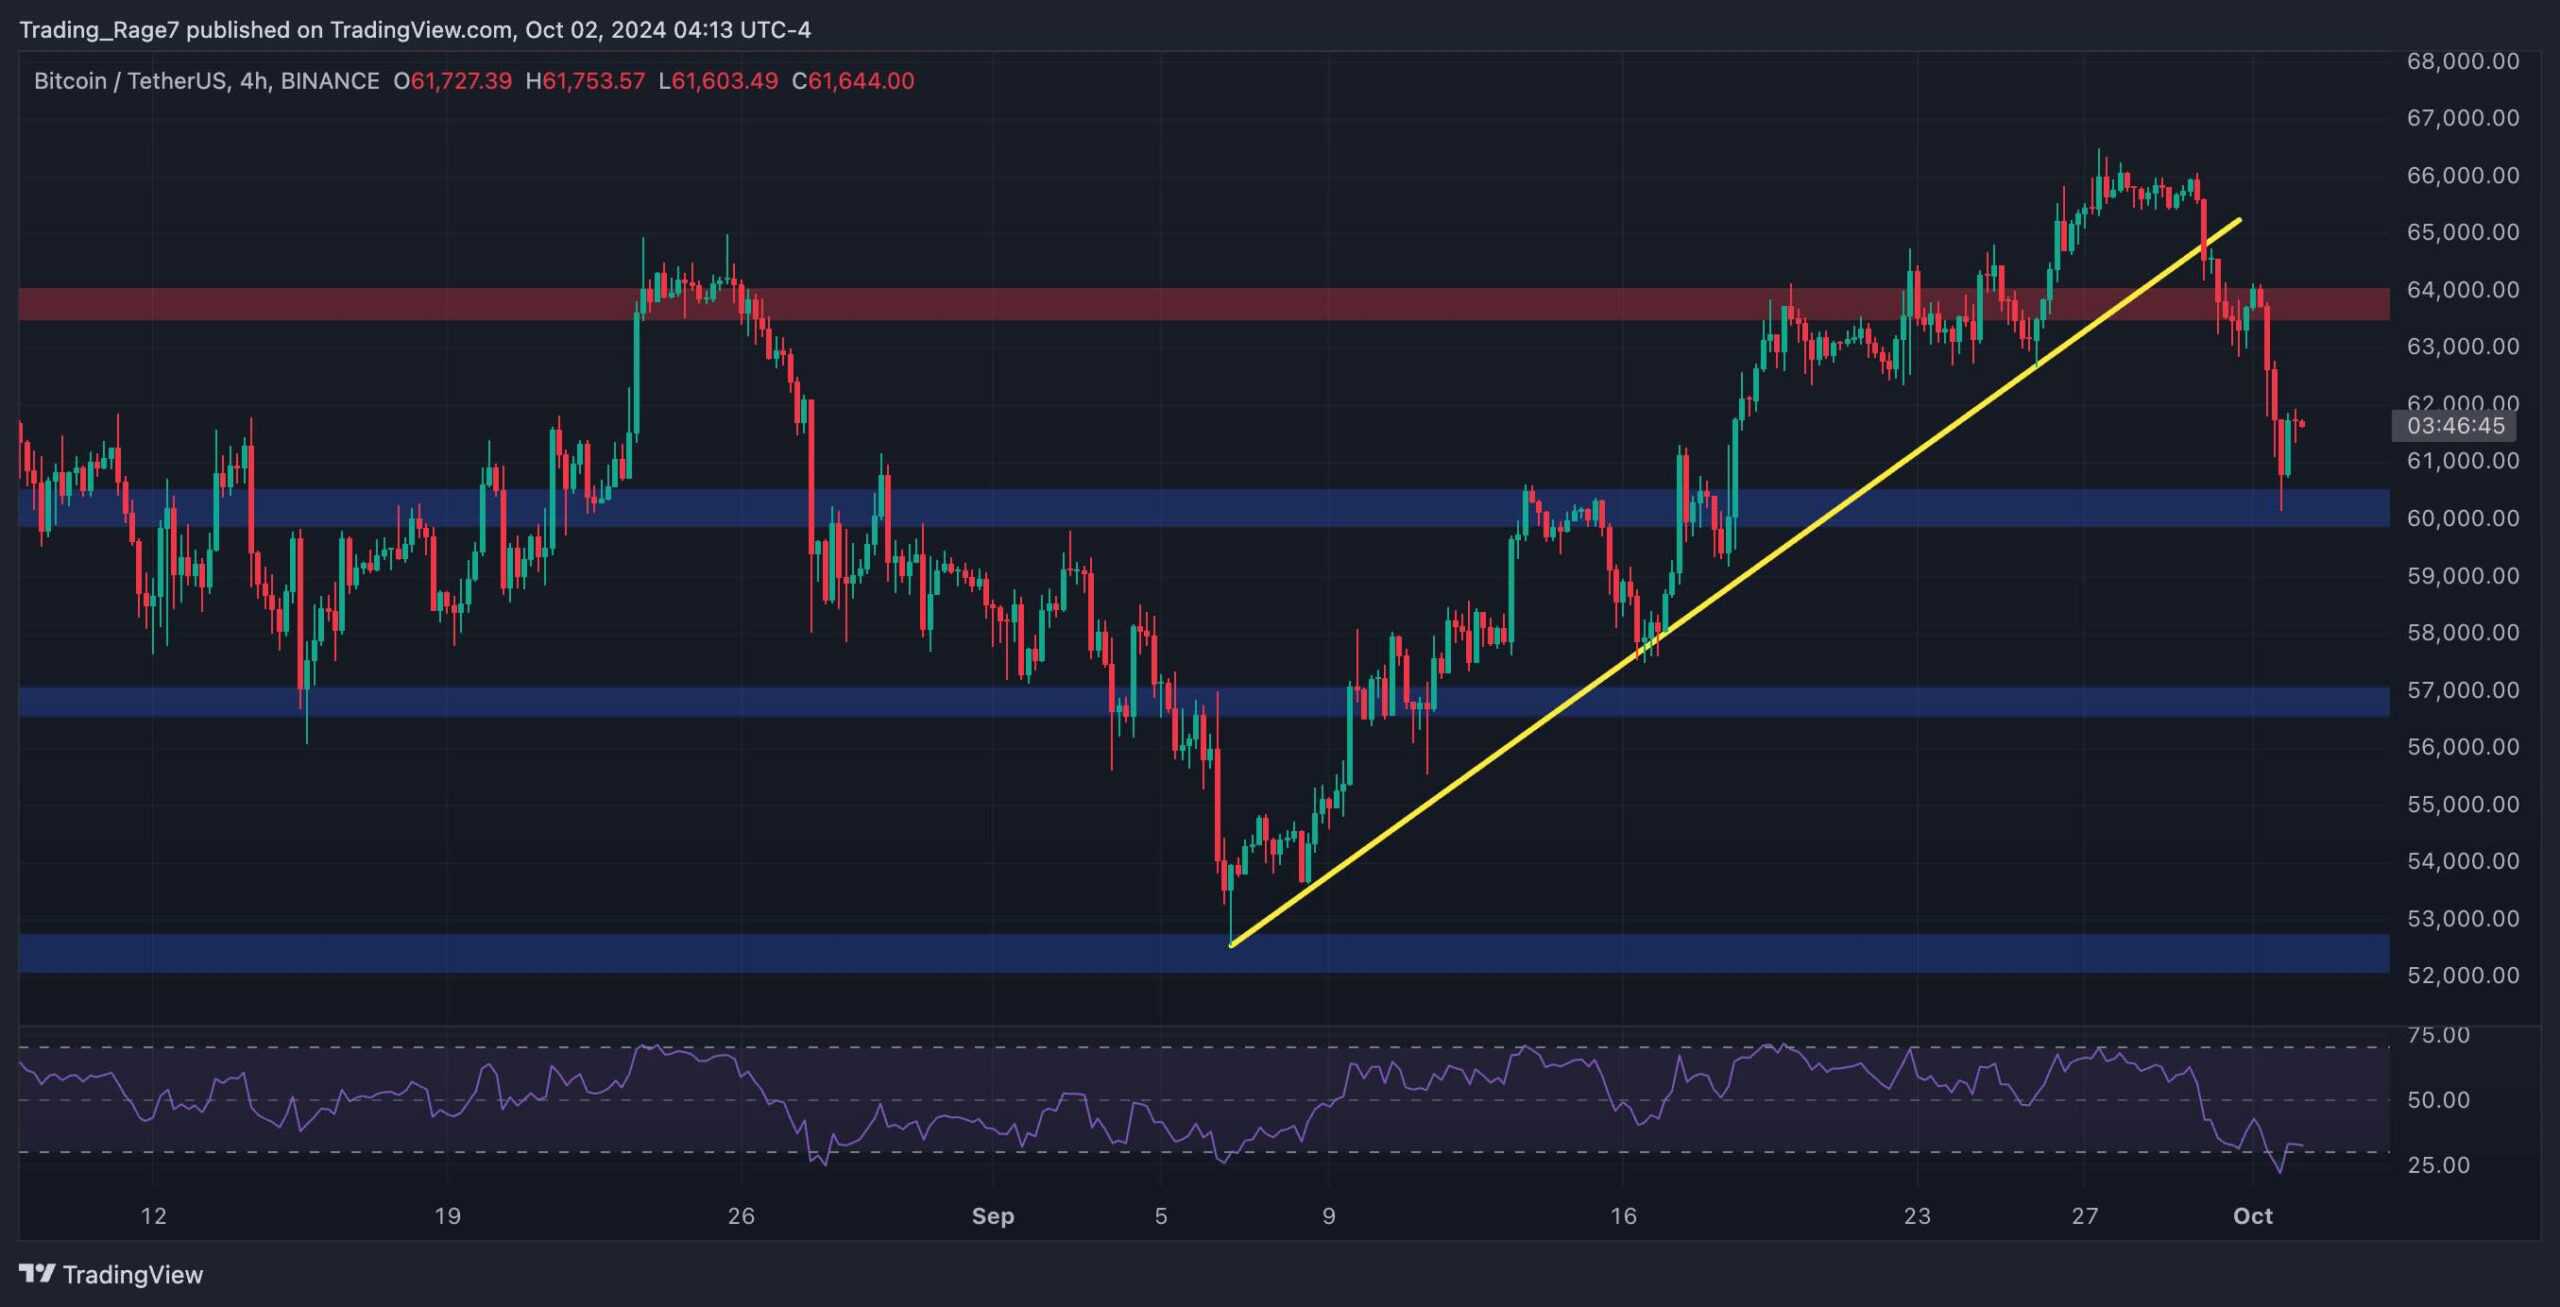
The 4-hour chart demonstrates a clear bearish shift in market structure in terms of classical price action. The market has decisively broken an important bullish trendline to the downside. Yet, the price bounced from the $60K level, as the RSI has also shown an oversold state in momentum.
Meanwhile, a complete rebound is still less probable, as the market structure suggests a deeper correction toward the $57K level is more likely. This scenario would, of course, fail if the price somehow climbs back above the $64K level soon.
On-Chain Analysis
By Edris Derakhshi (TradingRage)
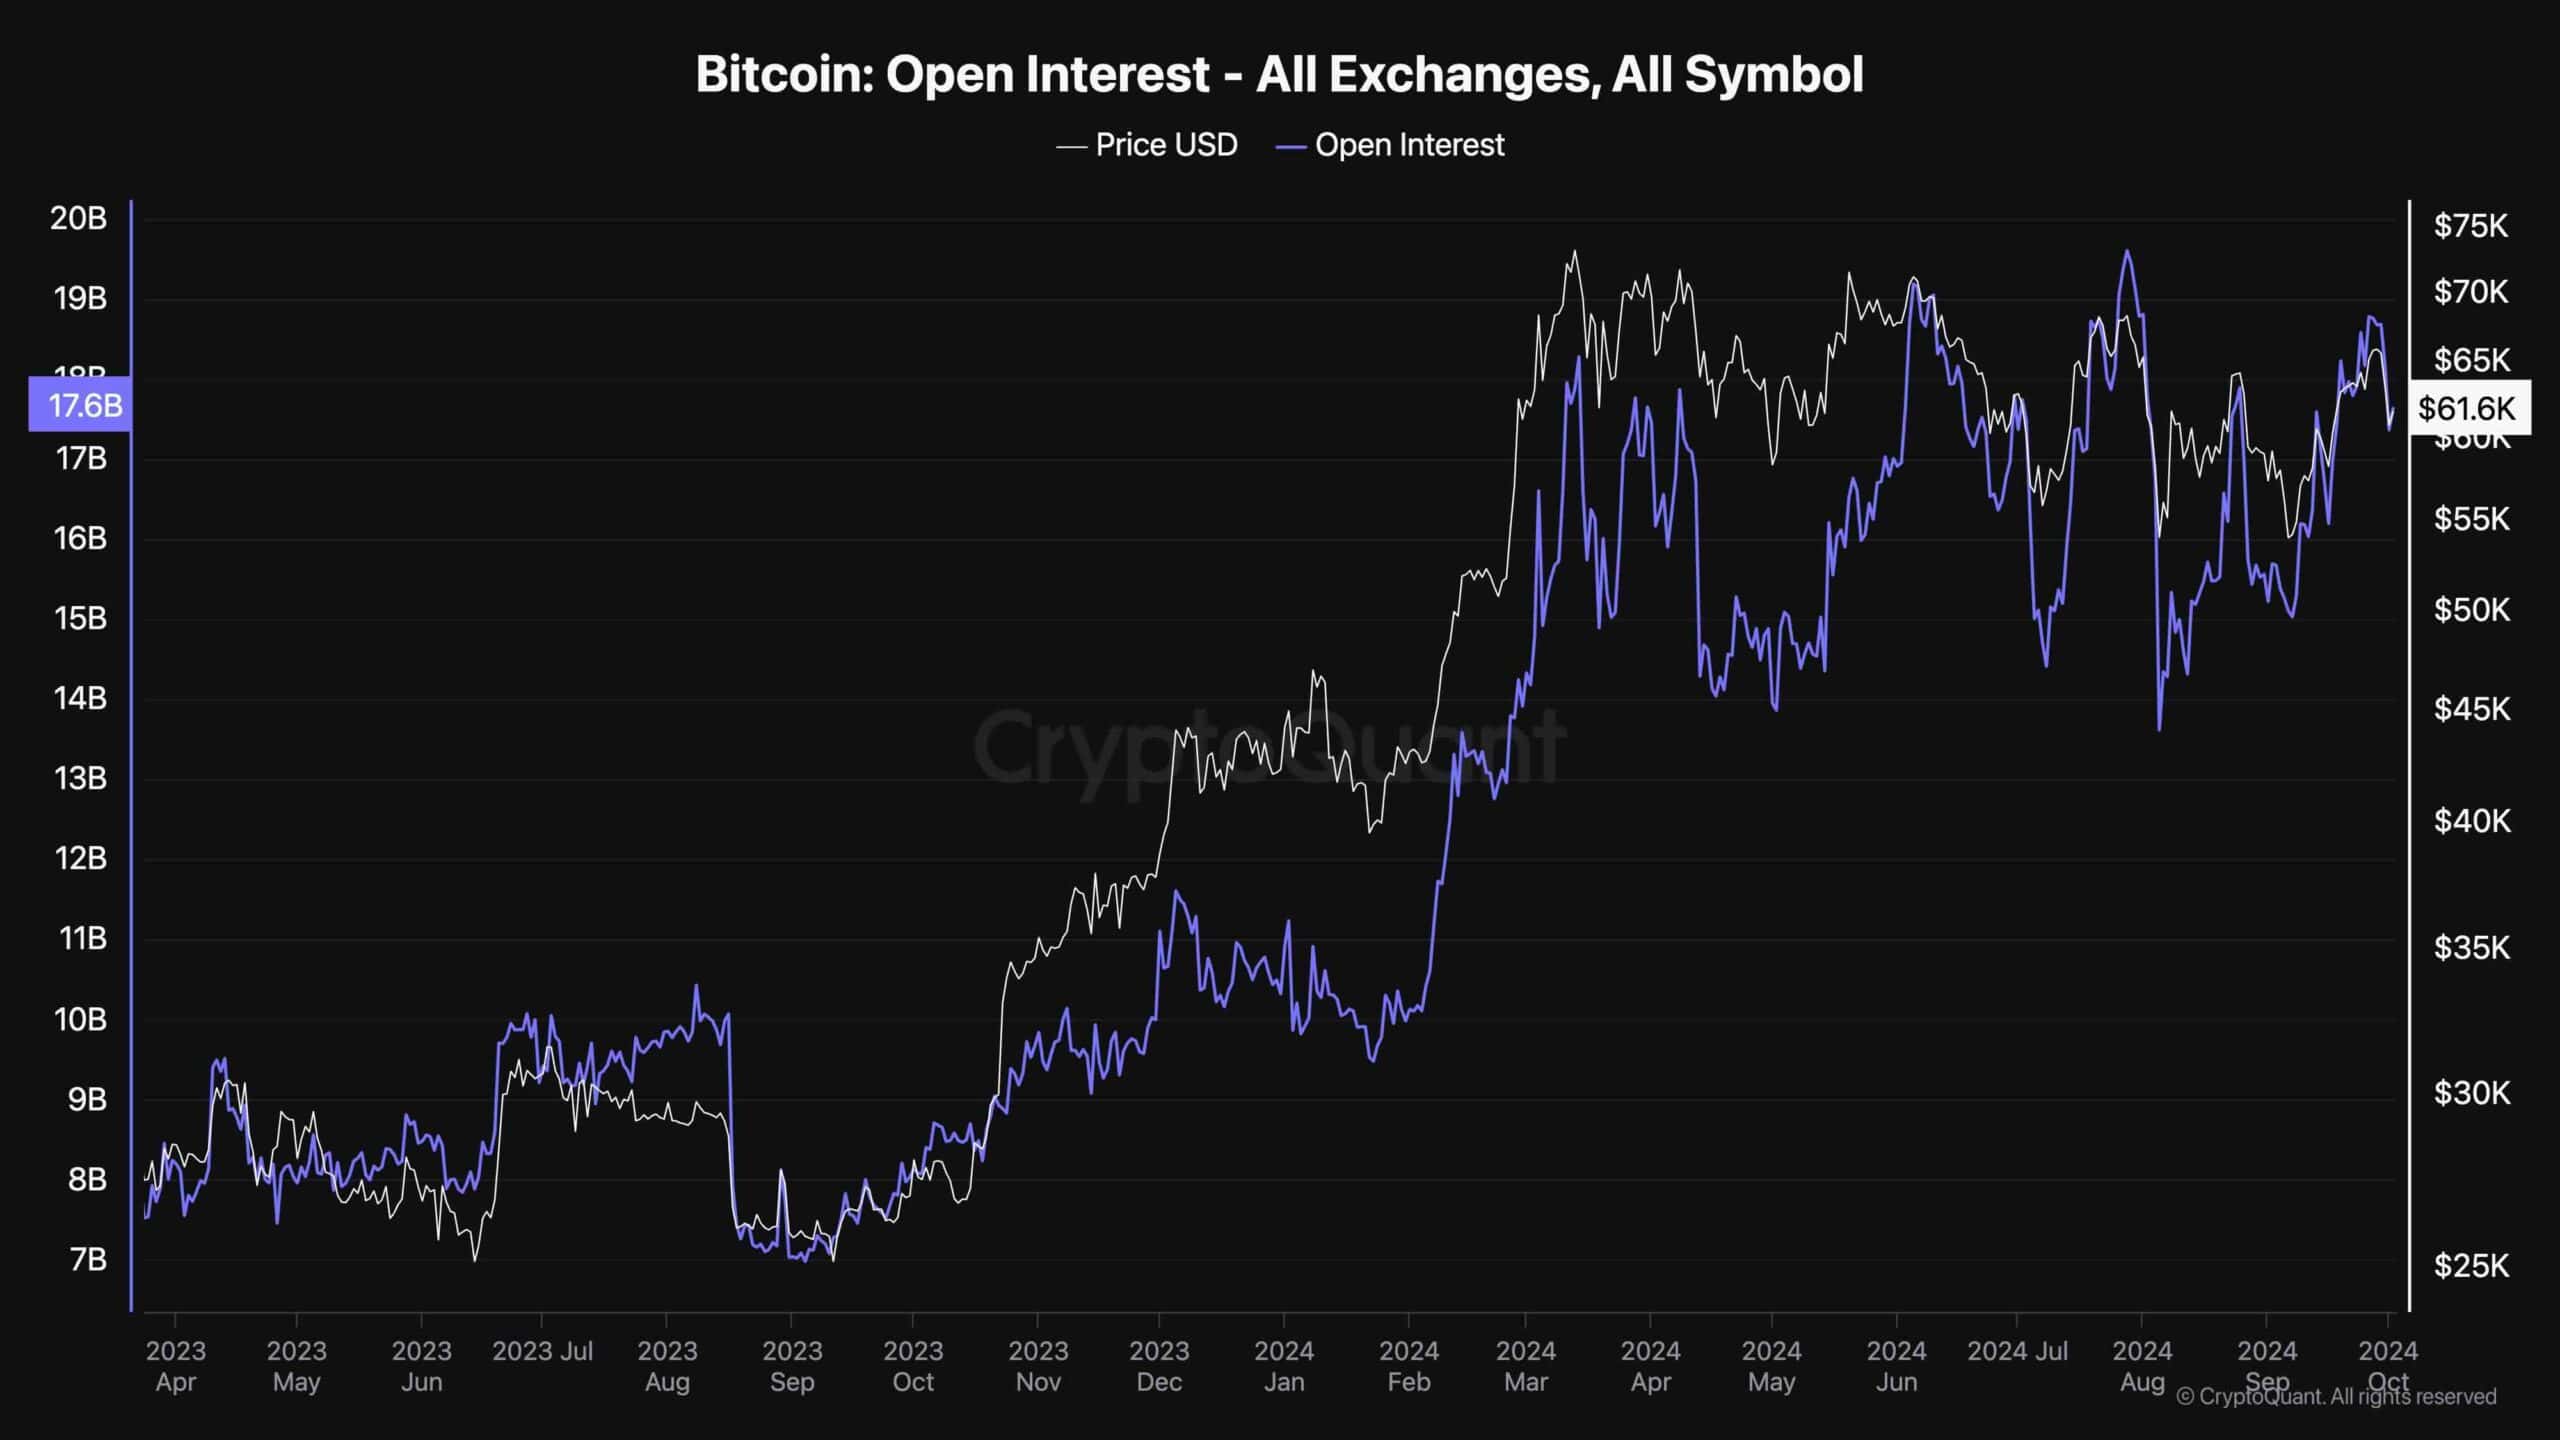
Bitcoin Open Interest
While Bitcoin’s price has been dropping over the past few days, future market sentiment metrics are still overheated.
This chart presents the BTC open interest, which shows the number of open perpetual futures positions, both bullish and bearish.
As the recent drop suggests, the minimal decline in open interest indicates that a long liquidation cascade has not occurred yet. A capitulation event would be highly probable in the event of a further price decline, which could lead to a rapid market crash and push the price even lower toward the $50K area.
The post Bitcoin Price Analysis: The Reason Behind BTC’s Crash to $60K Today appeared first on CryptoPotato.