Bitcoin Price Analysis: The Critical March-12 Support Saved BTC, But Now Facing Huge Resistance
Following our Thursday price analysis, Bitcoin had lost almost $1000 in one and a half days. This came straight after 3-4 failed attempts to break the $10,000 mark over the past two weeks.
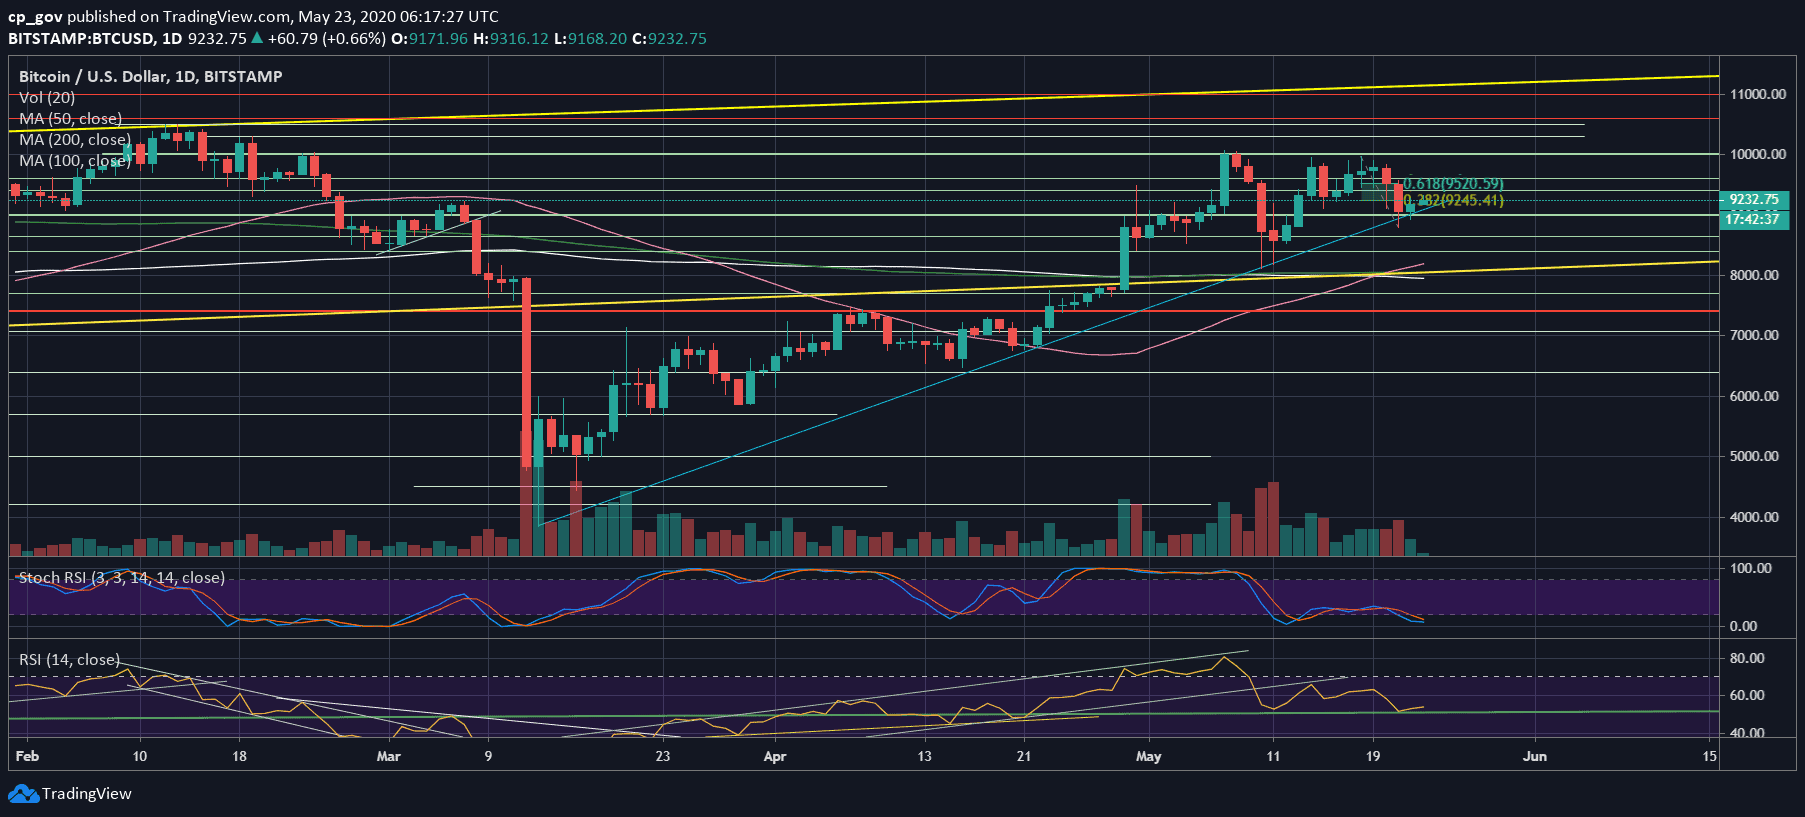
When you’re not breaking, and the attempts are losing strength, you will dump hard. This was the bad news; however, the good news is that a long-term ascending trendline saved Bitcoin, as of now.
The ascending trendline, marked blue on the following daily chart, was started forming on March 12, 2020, when Bitcoin crashed over 50% to $3600. Yesterday, Bitcoin reached down to the line at $8800 – $8900 and quickly rolled back above the $9K region.
Over the past hours, we see Bitcoin consolidating between the range of $9200 – $9300, a region that served as strong support now becomes strong resistance. The area also contains the Fibonacci retracement level 38.2% following Thursday’s price decline.
Total Market Cap: $258 billion
Bitcoin Market Cap: $170.4 billion
BTC Dominance Index: 66.1%
*Data by CoinGecko
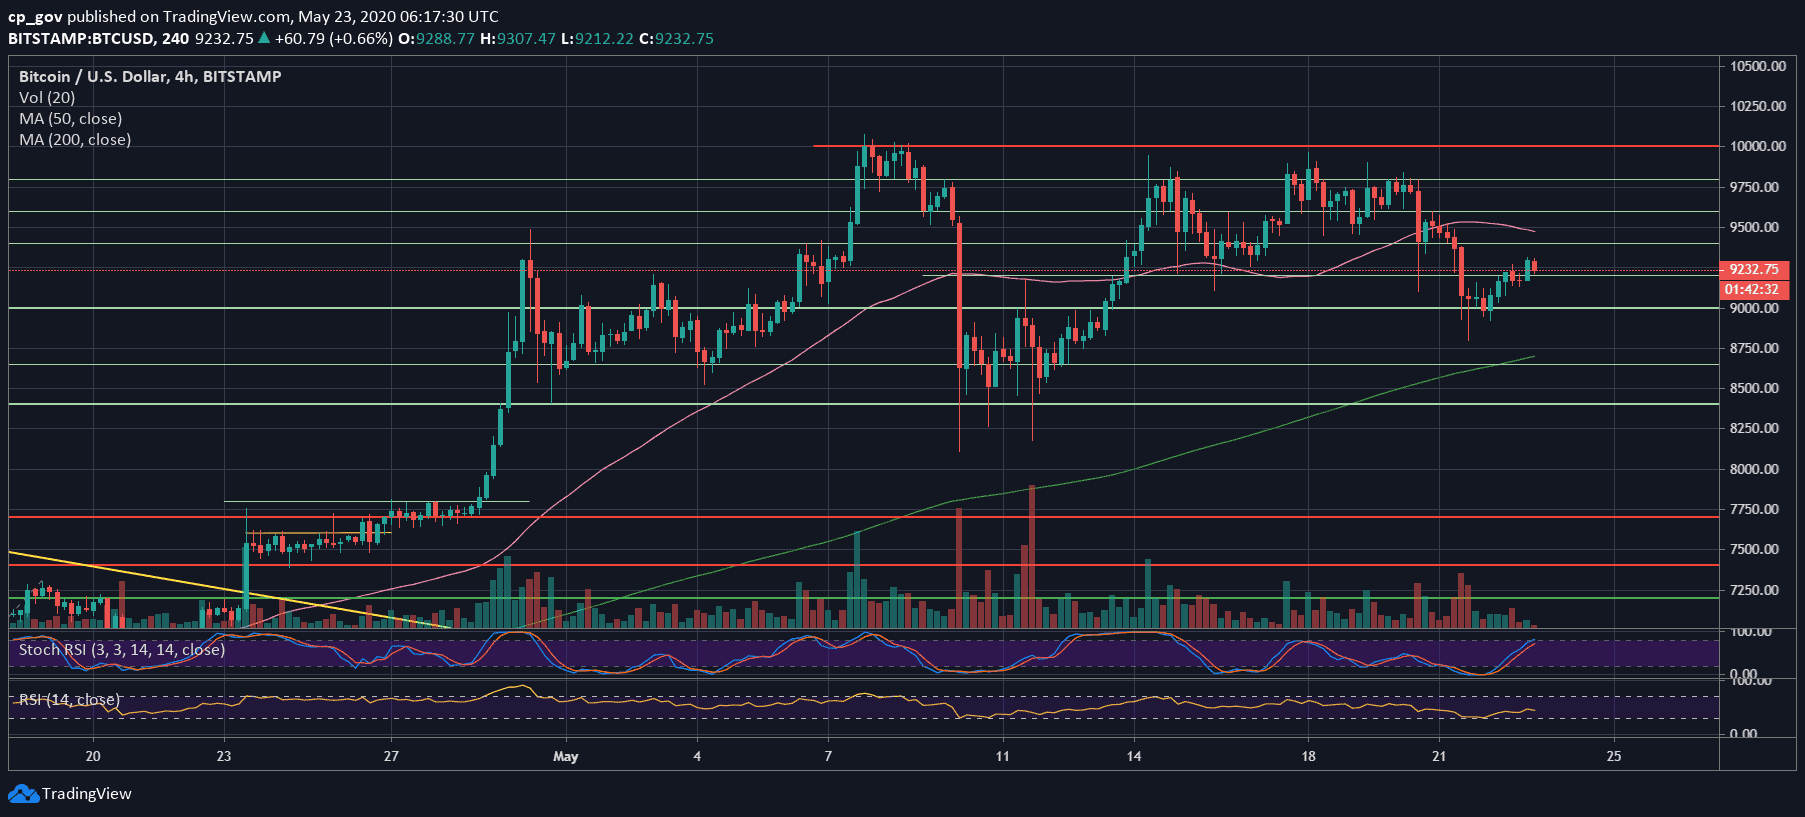
Bitcoin Short-term Support and Resistance Key Levels
As discussed above, Bitcoin is facing $9200 – $9300 as the first significant resistance level, as of writing these lines. In case Bitcoin fails here, then the first support would be the same ascending trend-line, which now lies around $9000.
This is followed by support levels at $8800, $8650, $8520, and $8400. Further down lies $8000 – $8200, the strong buy area, which also includes the three significant moving average lines – 50, 100 and 200 days.
From above, in case of a break-up, then the next level of resistance would be $9500, along with the Fib retracement level of 61.8%, $9600, and $9800.
The Technicals and Trading Volume
As discussed here on our previous price analysis, the RSI also encountered strong support at the 50 level. The support held firmly; however, not a lot had changed, telling by the momentum indicator.
Regarding the trading volume, after it was declining for the two weeks of the $10,000 tryouts, Thursday’s dump recorded the highest daily volume candle in 7 days. Not a bullish sign for Bitcoin, but too early to state.
BTC/USD BitStamp 4-Hour Chart
BTC/USD BitStamp 1-Day Chart
The post Bitcoin Price Analysis: The Critical March-12 Support Saved BTC, But Now Facing Huge Resistance appeared first on CryptoPotato.