Bitcoin Price Analysis: The Correction Is Here Following Huge $1000 Rally, But Was That The Bottom of 2019?
Bitcoin was a down-trend road for the past two weeks, and this is no secret. Yesterday the lowest price since May 2019 was reached once again – roughly around $6500.
Once it was reached, it completed a 10-days decline of $1100 or 15%. That was the right place to ask – “Is it a time for a correction,” which was the title of yesterday’s Bitcoin analysis.
A few hours later, the (maybe temporary) bottom was marked once again around $6500 and once again, we saw a quick correction back above. The first time Bitcoin reached $6500 it then reached $7900 after four days.
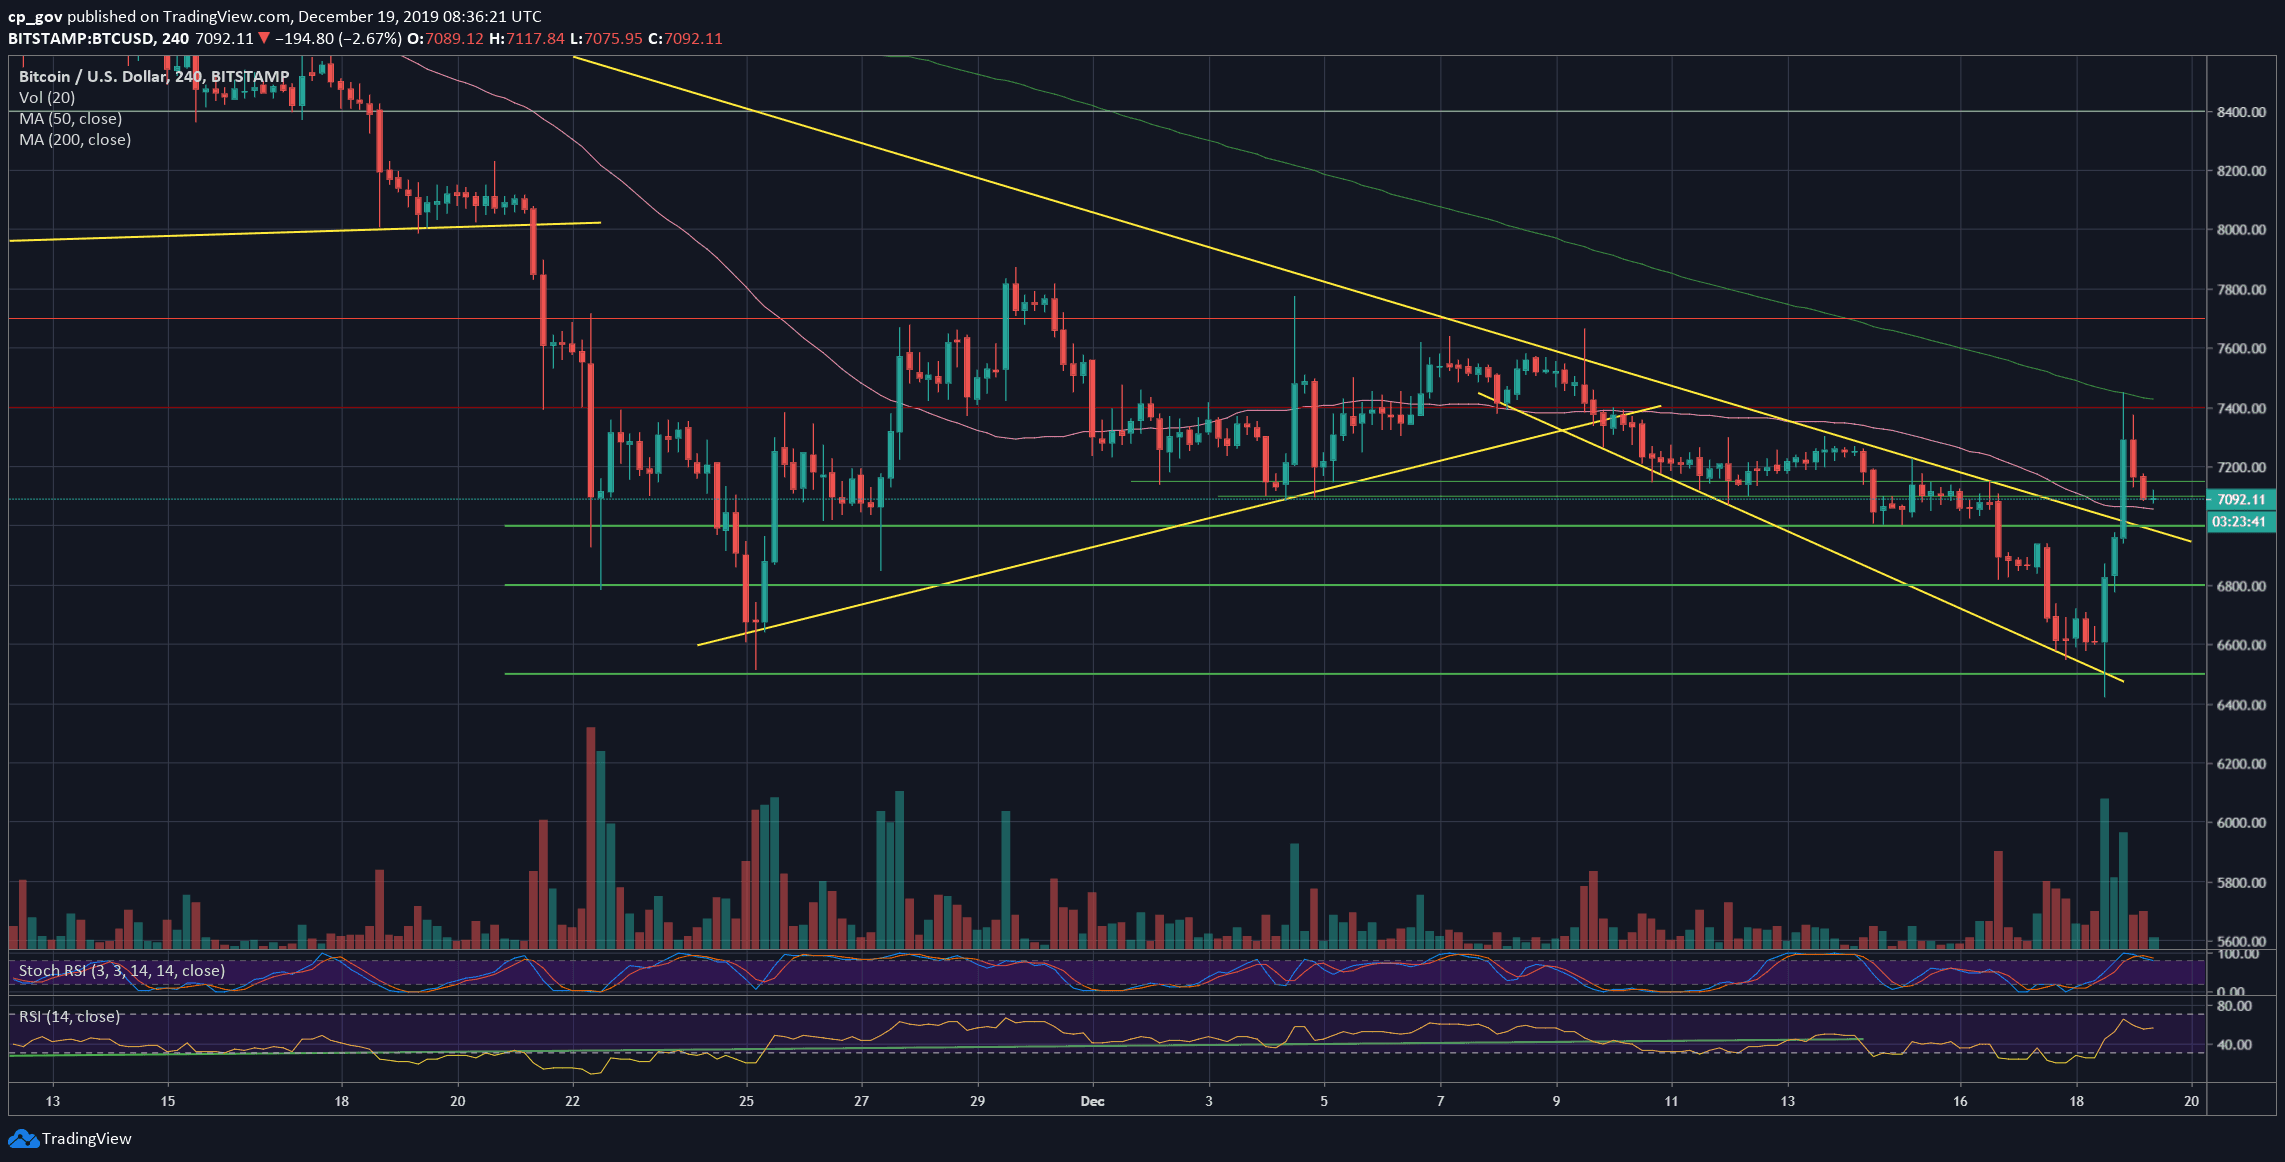
As mentioned here yesterday, the targets for a possible correction was the $7300 – $7400 area. As can be seen on the chart below, this morning, Bitcoin reached a peak at $7449 (Bitstamp). $7400 is also the significant 78.6% Fibonacci retracement level of the recent 10-days’ drop.
Besides, part of my bullish prediction was achieved: “The only bullish possibility is in case this setting turns into a double-bottom or a “W” shape pattern, where Bitcoin would have to break above the $7700 resistance line to return bullish.”
The second part, breaking above $7700, is the left question which is left unknown: Bitcoin is not yet back to the safe-zone, since once the coin reached the $7300 – $7400, it got quickly rejected. As of writing this update, Bitcoin is trading at $7100.
Total Market Cap: $187 billion
Bitcoin Market Cap: $128 billion
BTC Dominance Index: 68.3%
*Data by CoinGecko
Key Levels to Watch
– Support/Resistance: After getting rejected at the $7300 – $7400 zone, this has officially become the first obstacle-resistance for Bitcoin on its way back up.
In case of a breakout, then the next significant level lies at $7700, before the good-old $8000 resistance.
From below, the current price area of $7000 – $7100 is the first level of support. Further below lies $6800, and $6500 – $6600, which is the low from yesterday, as well as the lowest price since May 17, 2019.
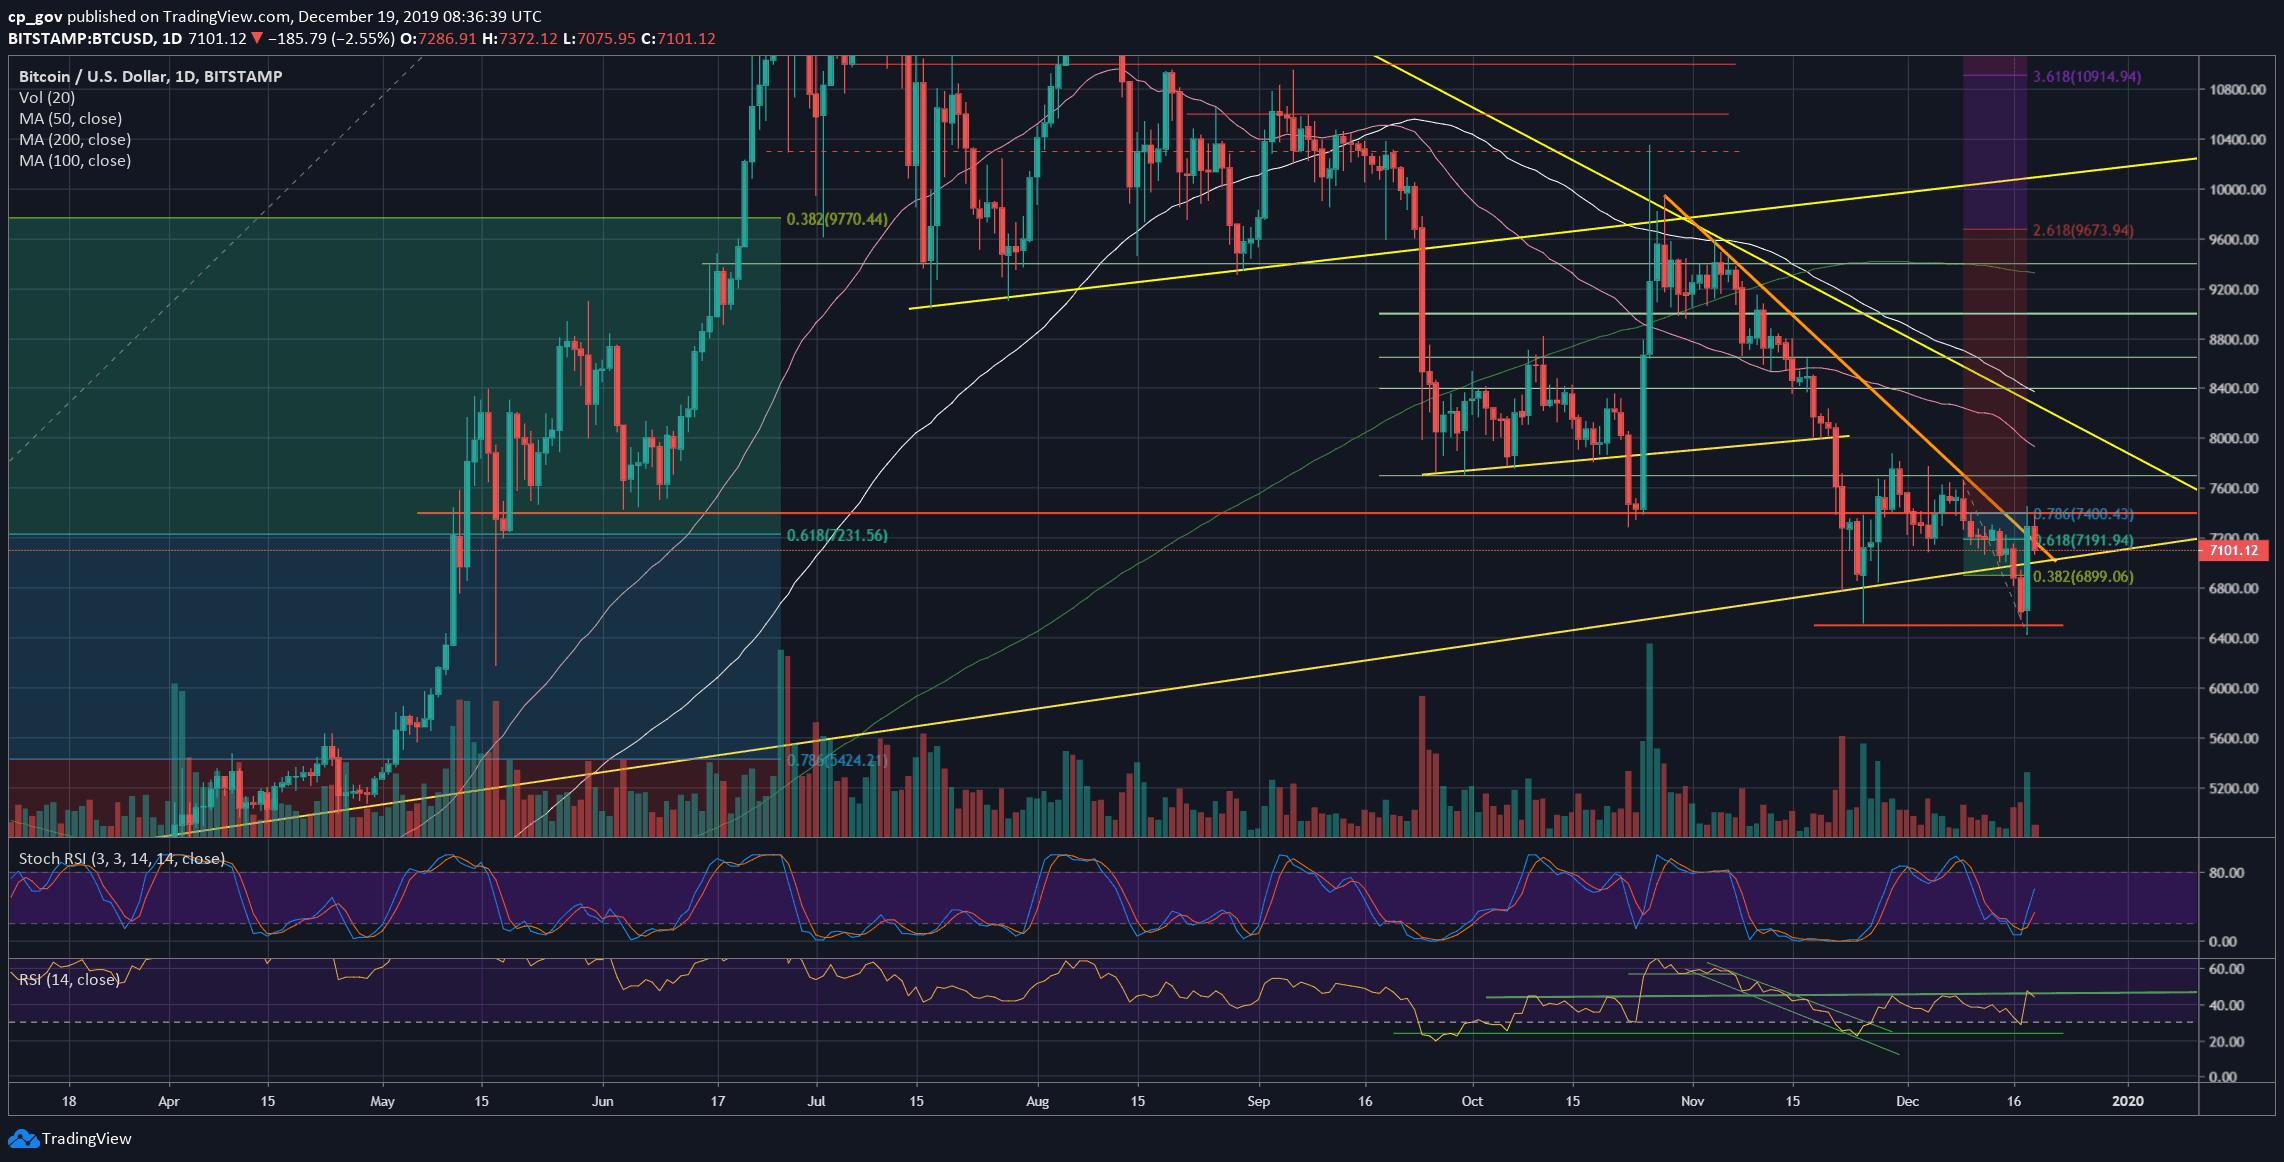
In case of a breakdown from here, then $6300 might be the next possible target. Further down is $6100 and $6000. If we zoom out a bit, we can start seeing $5400 as a potential longer-term target. The last is the 78.6% Fibonacci retracement level of the 2019 first half bullish move (up to $13,880 in June).
– The RSI Indicator: Like a textbook: Once the RSI encountered the crucial 30 support level, it turned around bullish, and quickly reached the 45 area, which is the marked ascending trend-line on the daily chart. Bitcoin couldn’t resist, and found a top there, as of writing this.
Stochastic RSI oscillator proved once again that it’s one of the most trusted technical indicators out there: A classic bullish cross at the oversold territory took place yesterday, while Bitcoin was only starting its price explosion.
– Trading volume: The reversal day of yesterday translated to a massive amount of volume. Yesterday’s volume candle was the highest since November 25. This is a bullish sign.
BTC/USD BitStamp 4-Hour Chart
BTC/USD BitStamp 1-Day Chart
The post Bitcoin Price Analysis: The Correction Is Here Following Huge $1000 Rally, But Was That The Bottom of 2019? appeared first on CryptoPotato.


